OnlyCrops AI Blog
Farming tips, AI guides, and stories from the field.
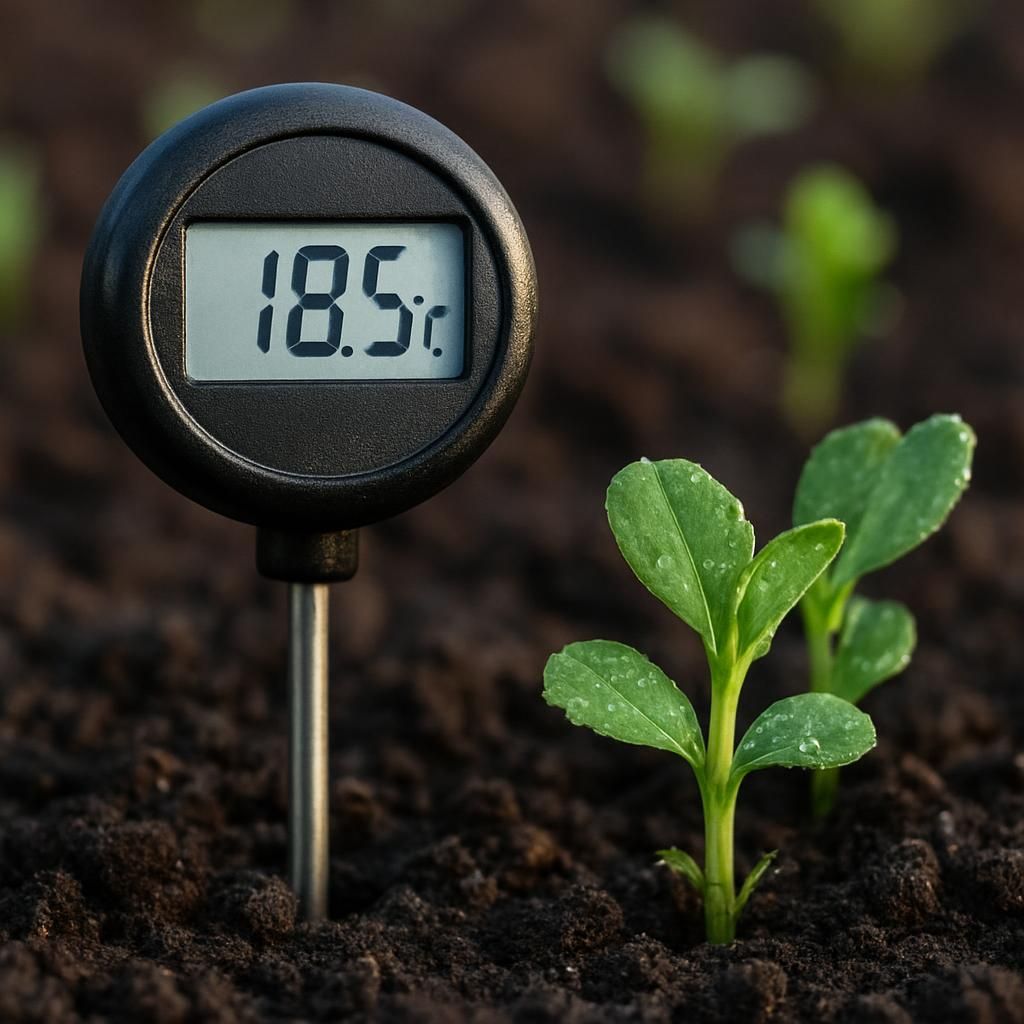
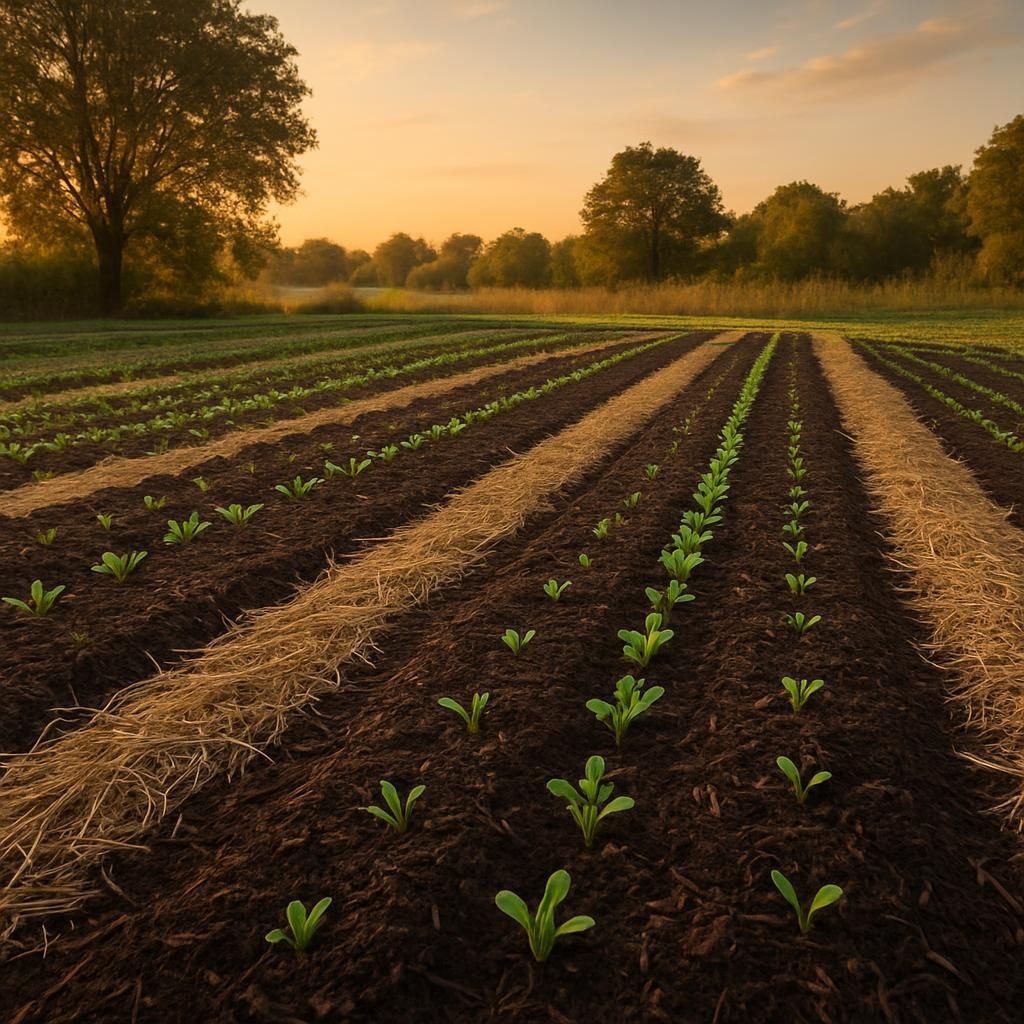
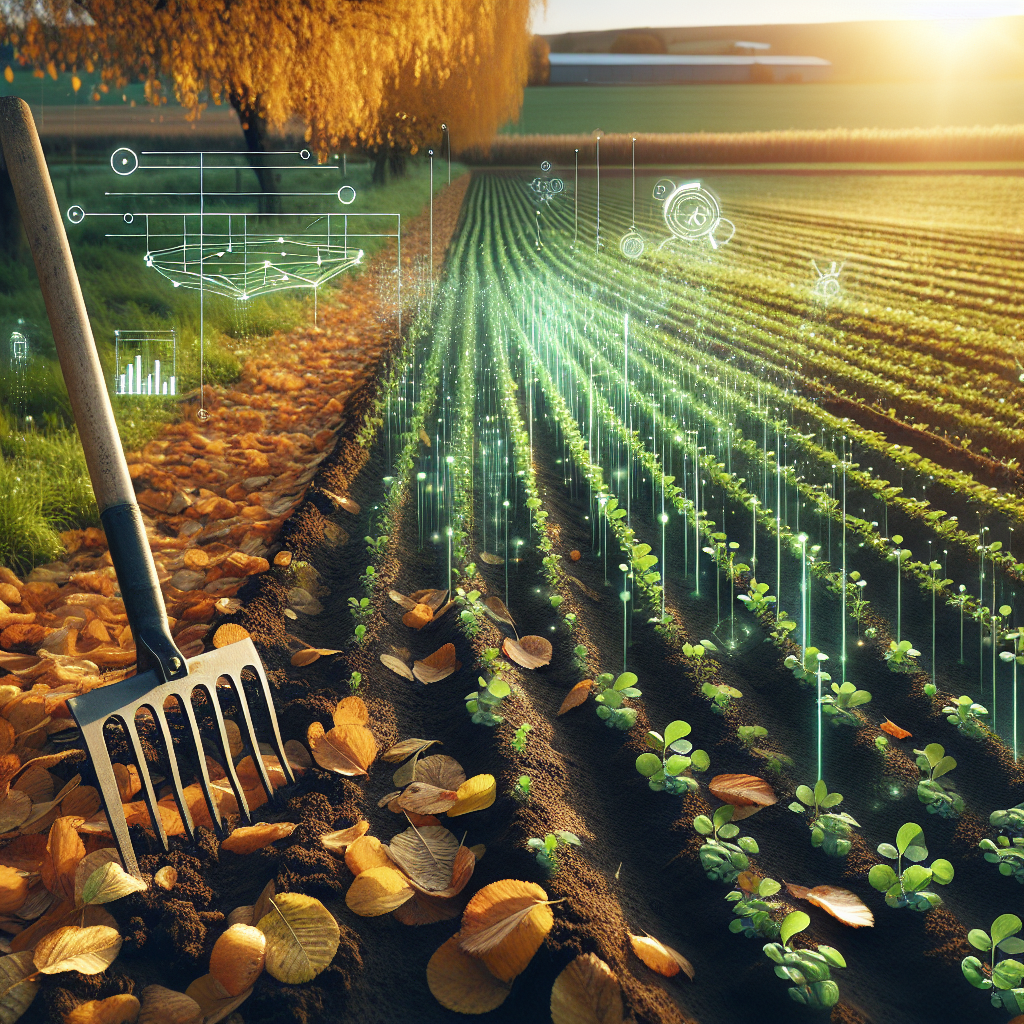
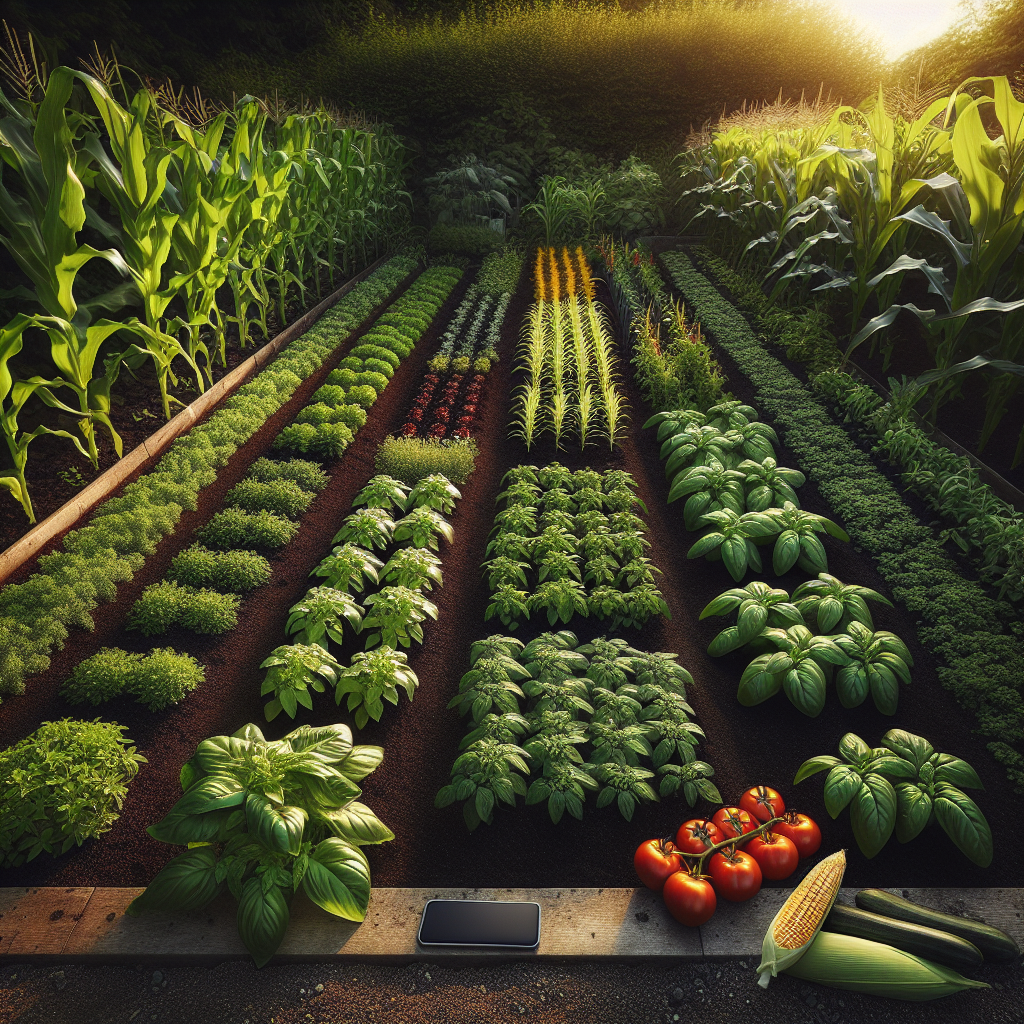
Stop Relying on Generic Seed Packets: Track Your Own Germination Windows Instead
June 22, 2026
Most small farms lose weeks of production because they follow the same planting dates printed on seed packets every season. This guide shows how to build your own microclimate data and create reliable germination timelines that actually match your land.
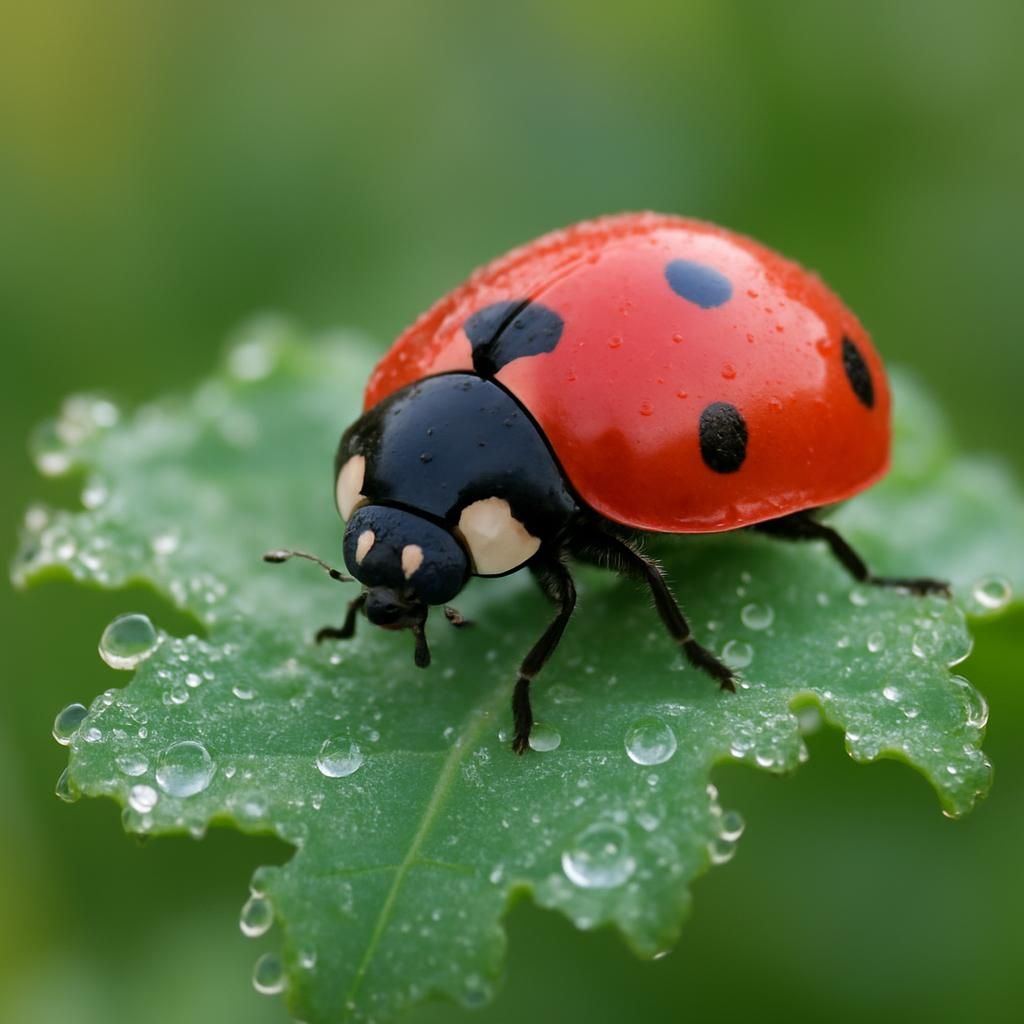
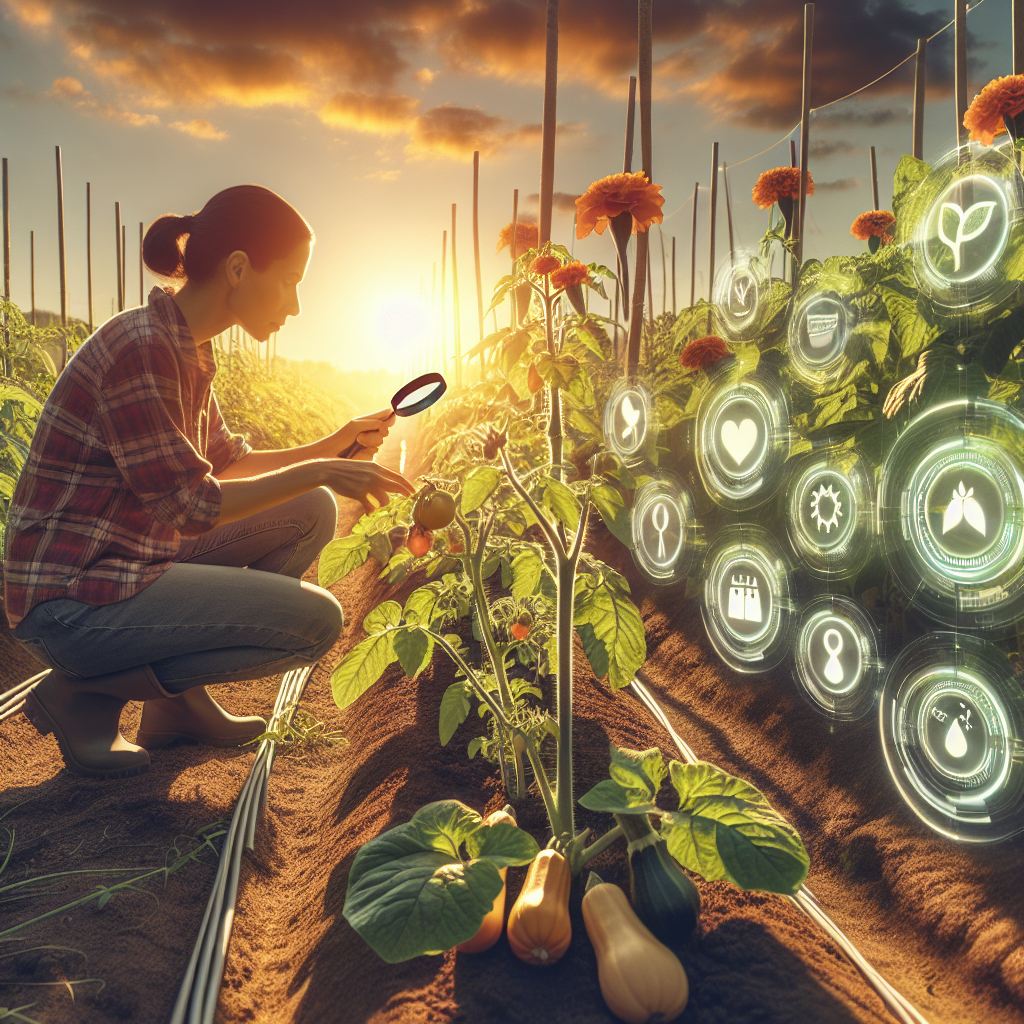
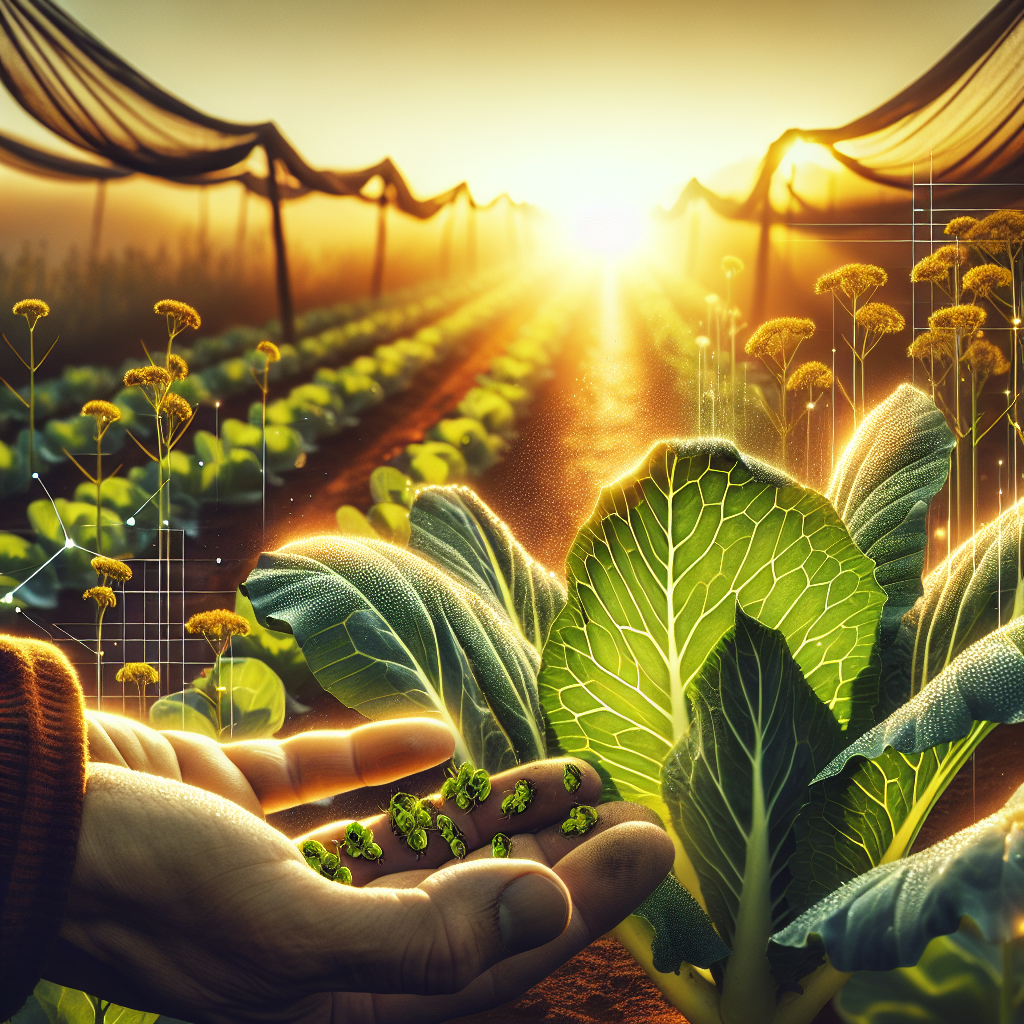
My 5 Biggest Failures with Spring Pest Patrol
June 10, 2026
A candid look at common spring pest management mistakes that cost small farms time, money, and harvests. Learn practical organic strategies to protect your crops from the very first warm days.
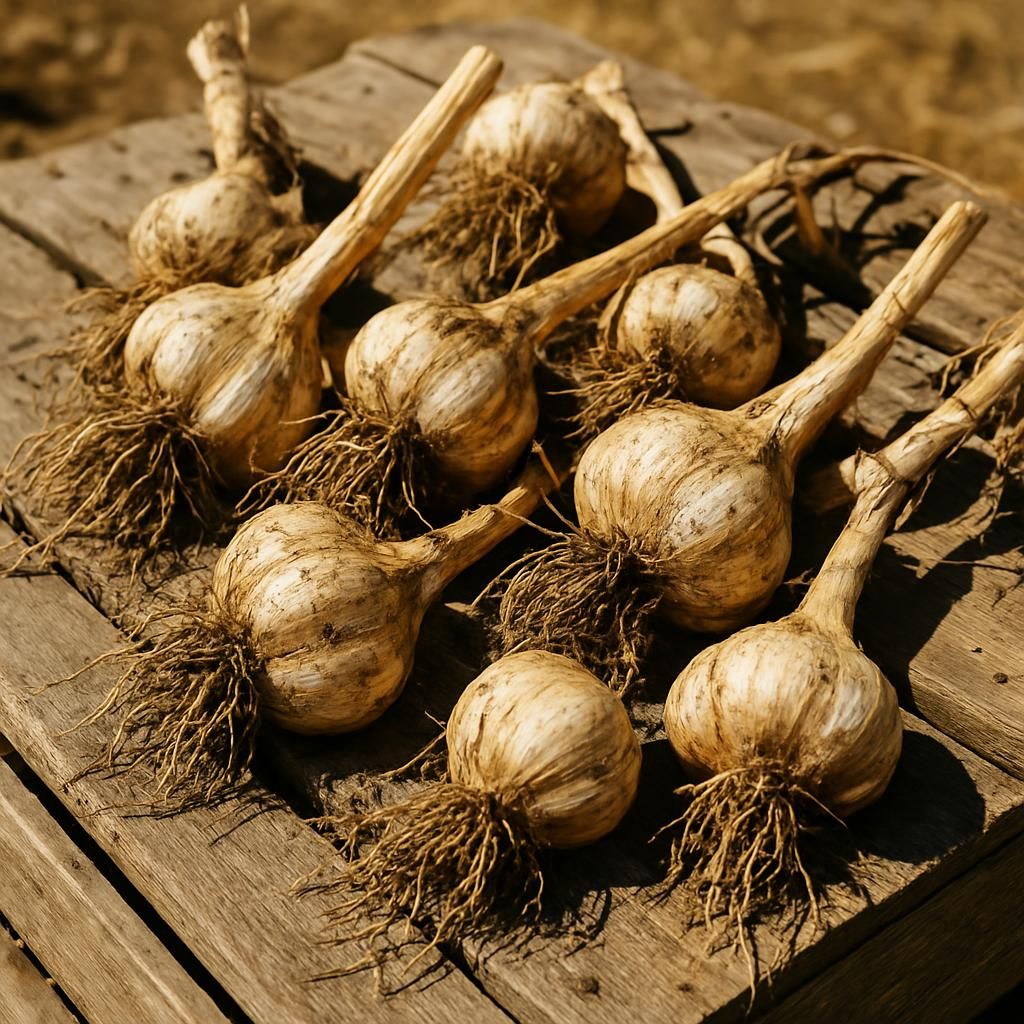
The Economics of Garlic
June 6, 2026
Garlic production costs and returns vary wildly depending on scale, variety, and market timing. This breakdown reveals where small operations actually make or lose money.
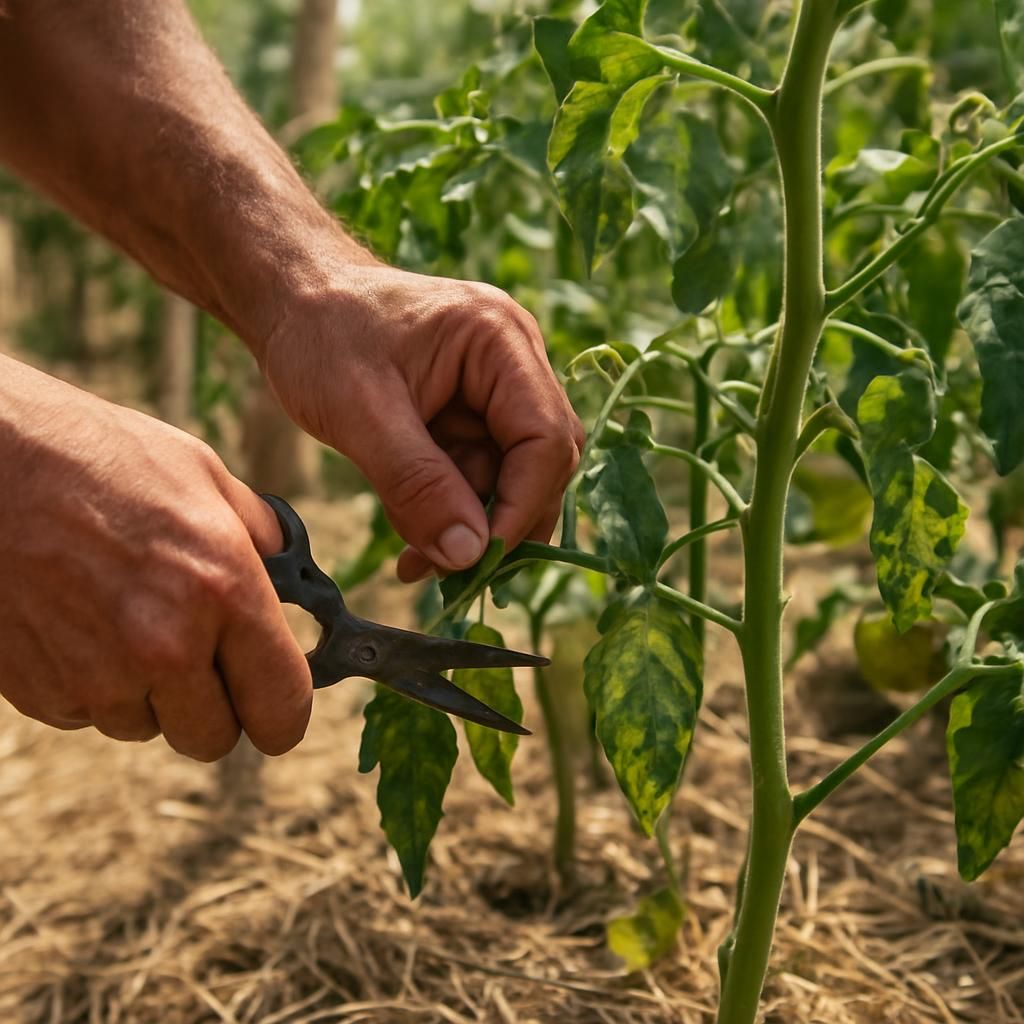
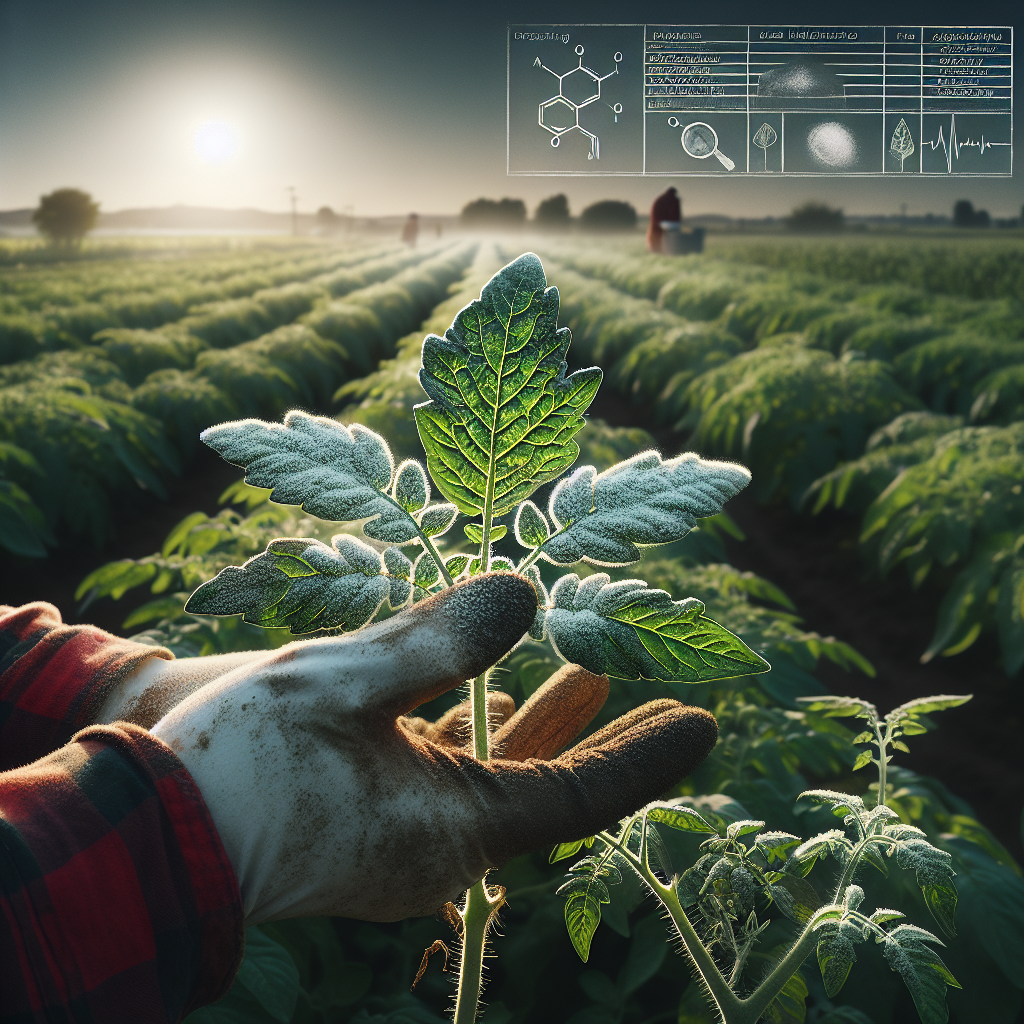
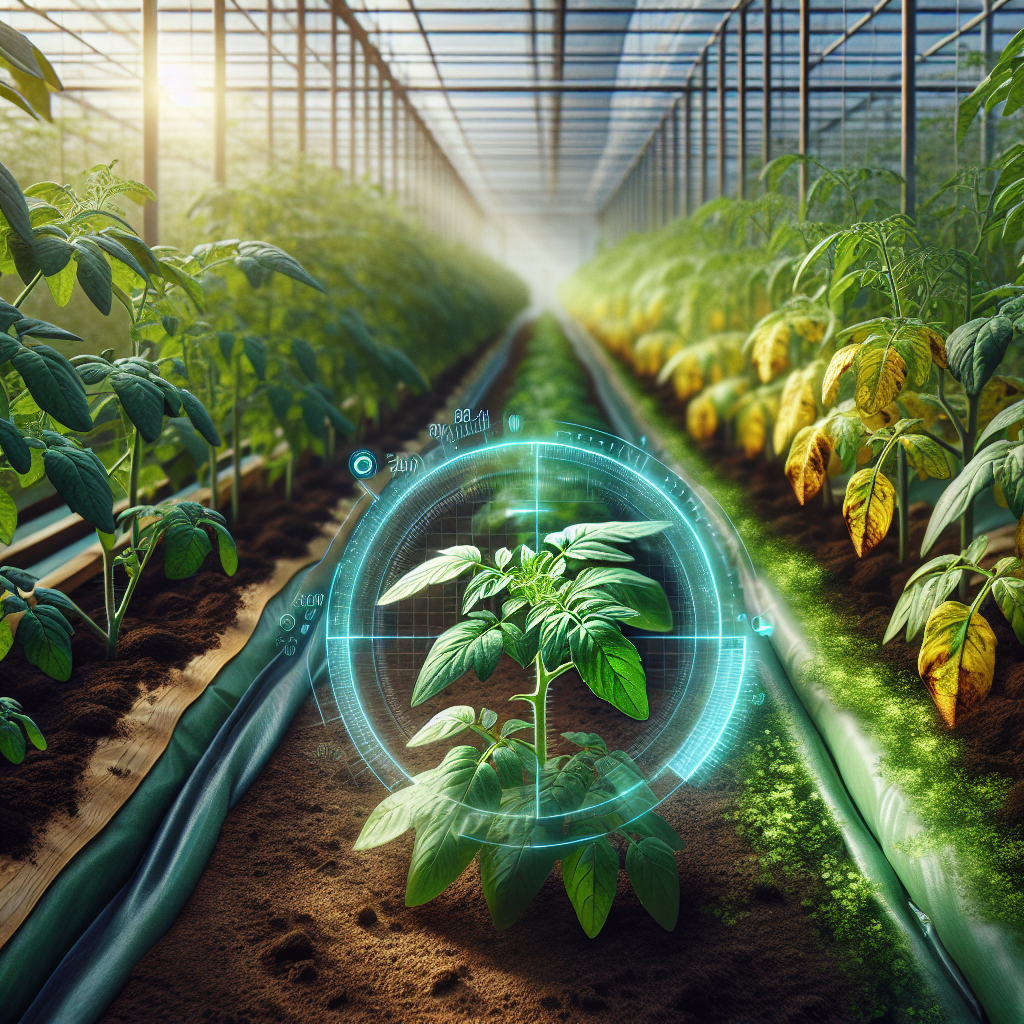
Stop Treating Tomato Blight Like a Spray Problem: Here Is What Works Better
June 3, 2026
Most small growers respond to tomato blight too late and with the wrong tools. This practical guide breaks down a prevention-first system for identifying risk, reducing leaf wetness, improving airflow, and limiting losses with organic methods.
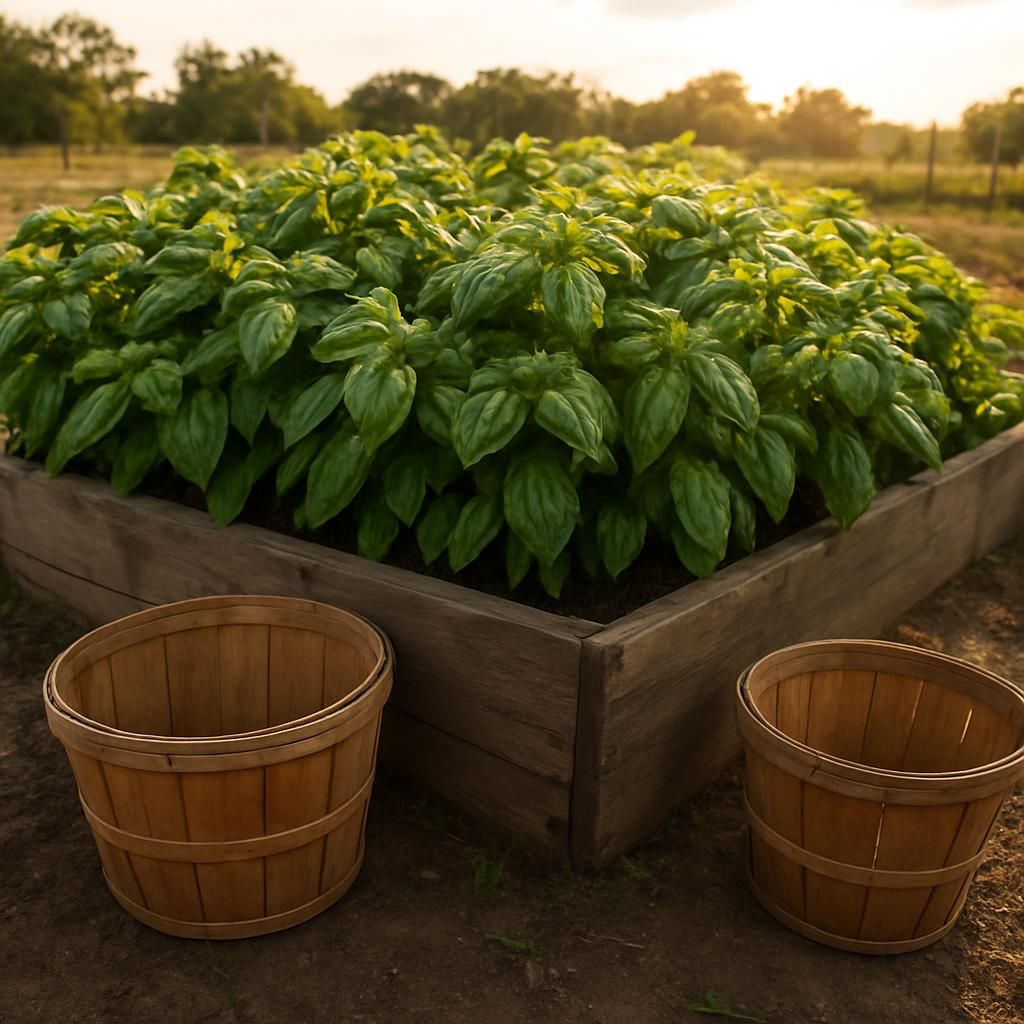
The Economics of Basil: A Brutal Breakdown
June 2, 2026
Basil offers fast turnover and strong margins for small farms, but only if growers control inputs and capture every sale opportunity. This analysis shows exactly where the money moves and where it disappears.
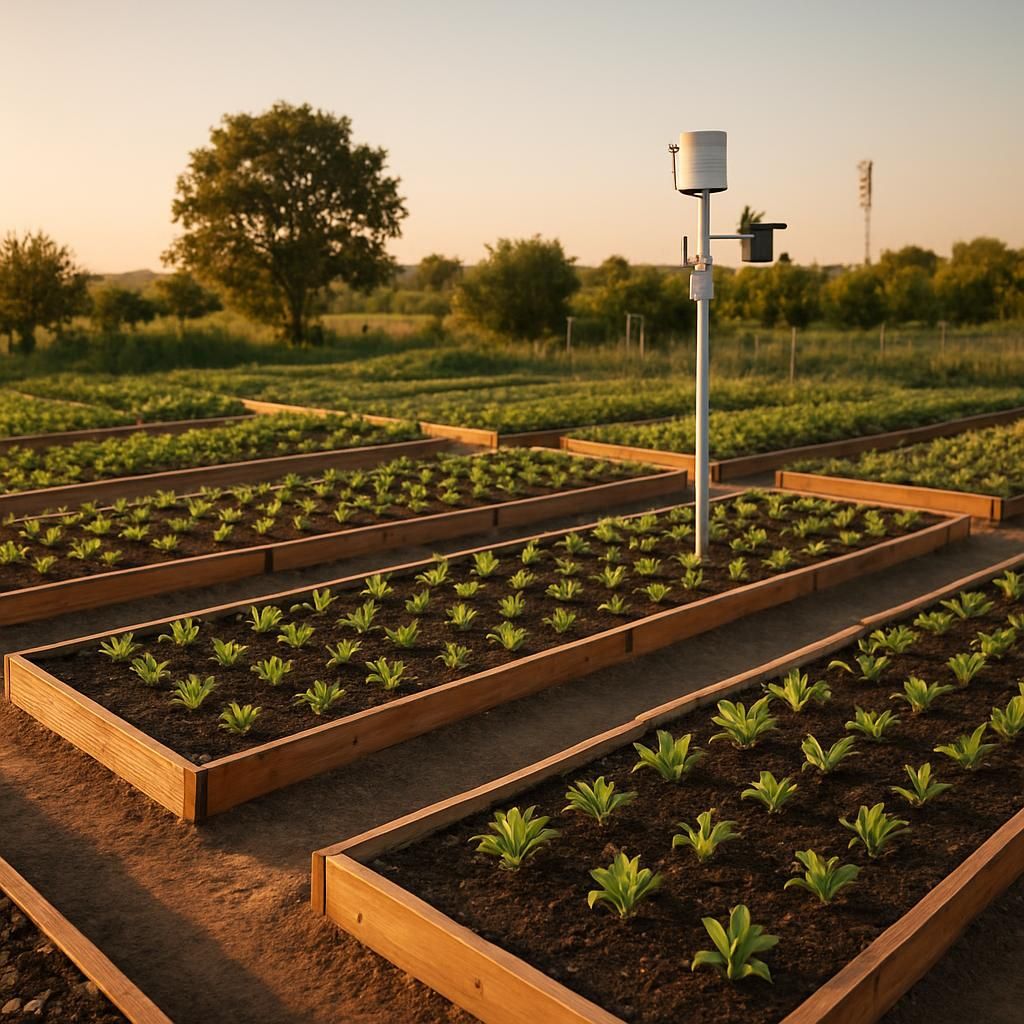
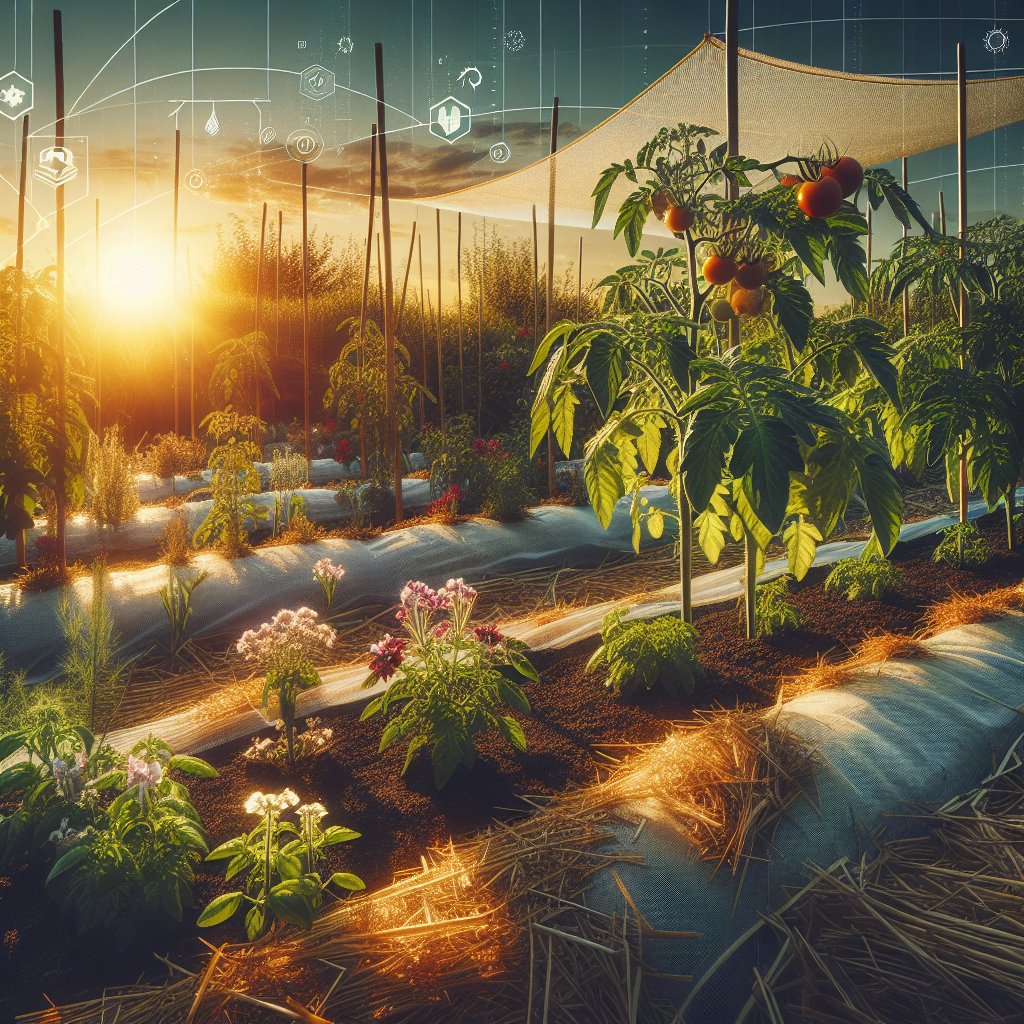
The Truth About Weather Patterns and Small Farm Resilience
May 22, 2026
Weather can make or break a small farm season, but understanding microclimates and local patterns gives growers a real advantage. This guide shows practical ways to track, interpret, and respond to conditions without expensive equipment.
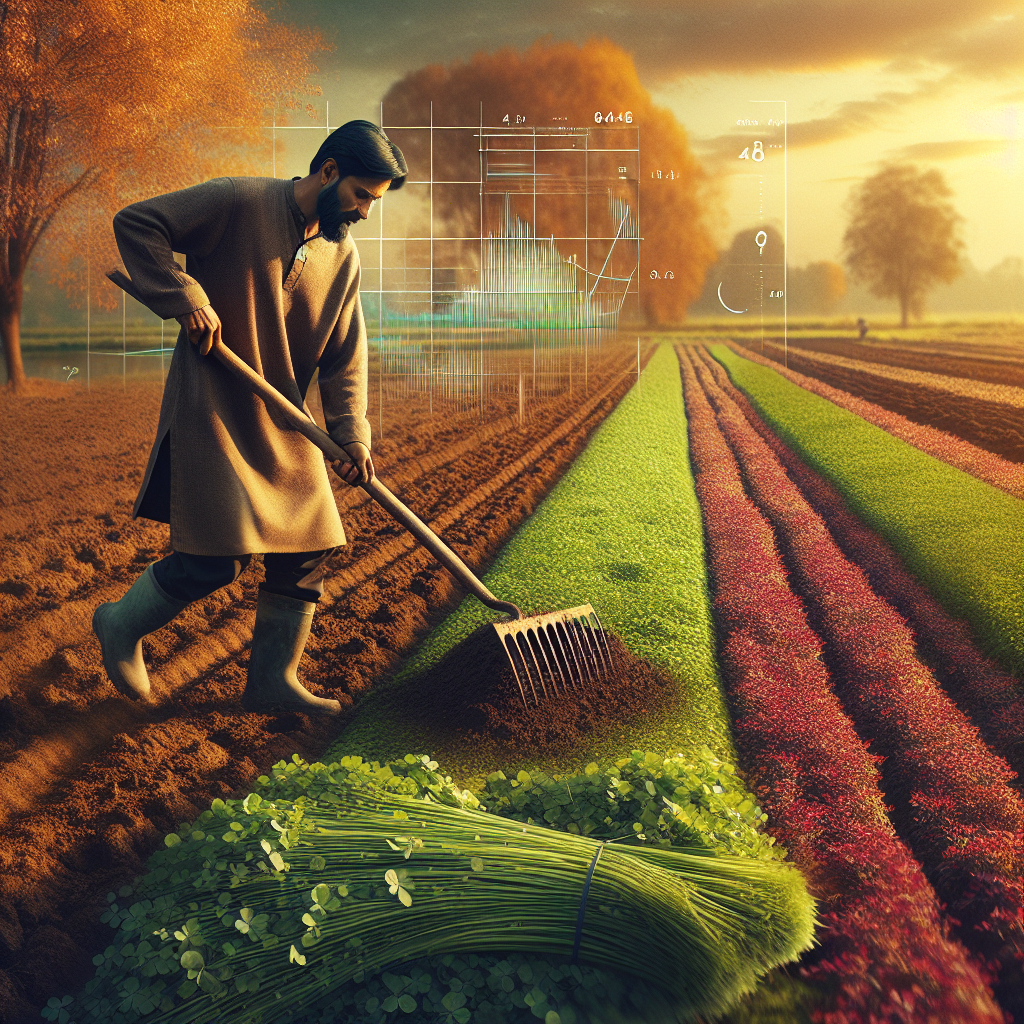
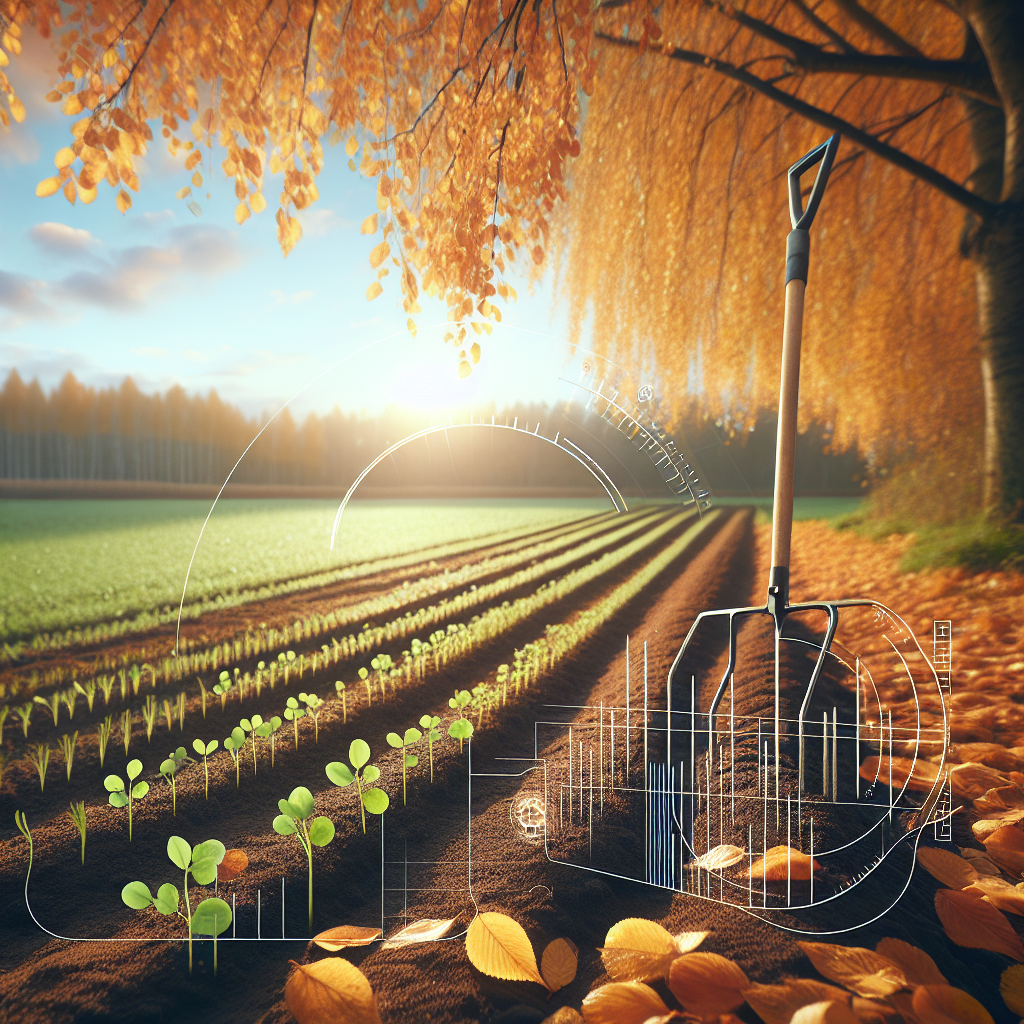
The Truth About Fall Garden Transitions for Small Farm Resilience
May 18, 2026
Fall garden transitions require thoughtful timing and soil preparation to carry small farms successfully into winter. This guide walks through proven organic methods that protect soil life, reduce pest pressure, and set up stronger spring growth.
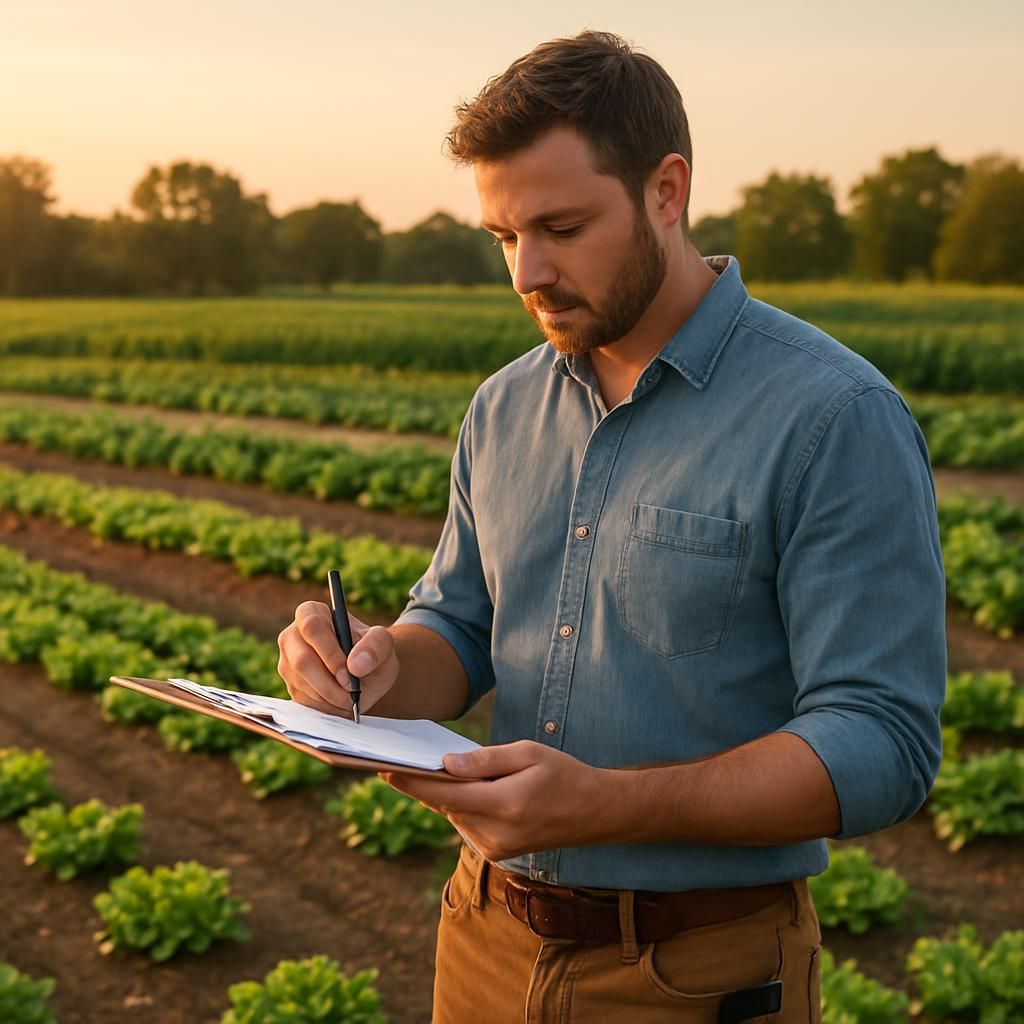
A Season of Strategic Planning for Small Farm Success
May 17, 2026
Strategic planning transforms scattered daily efforts into consistent results across every growing season. This guide shows small farmers how to build simple systems that protect time, soil, and income without adding complexity.
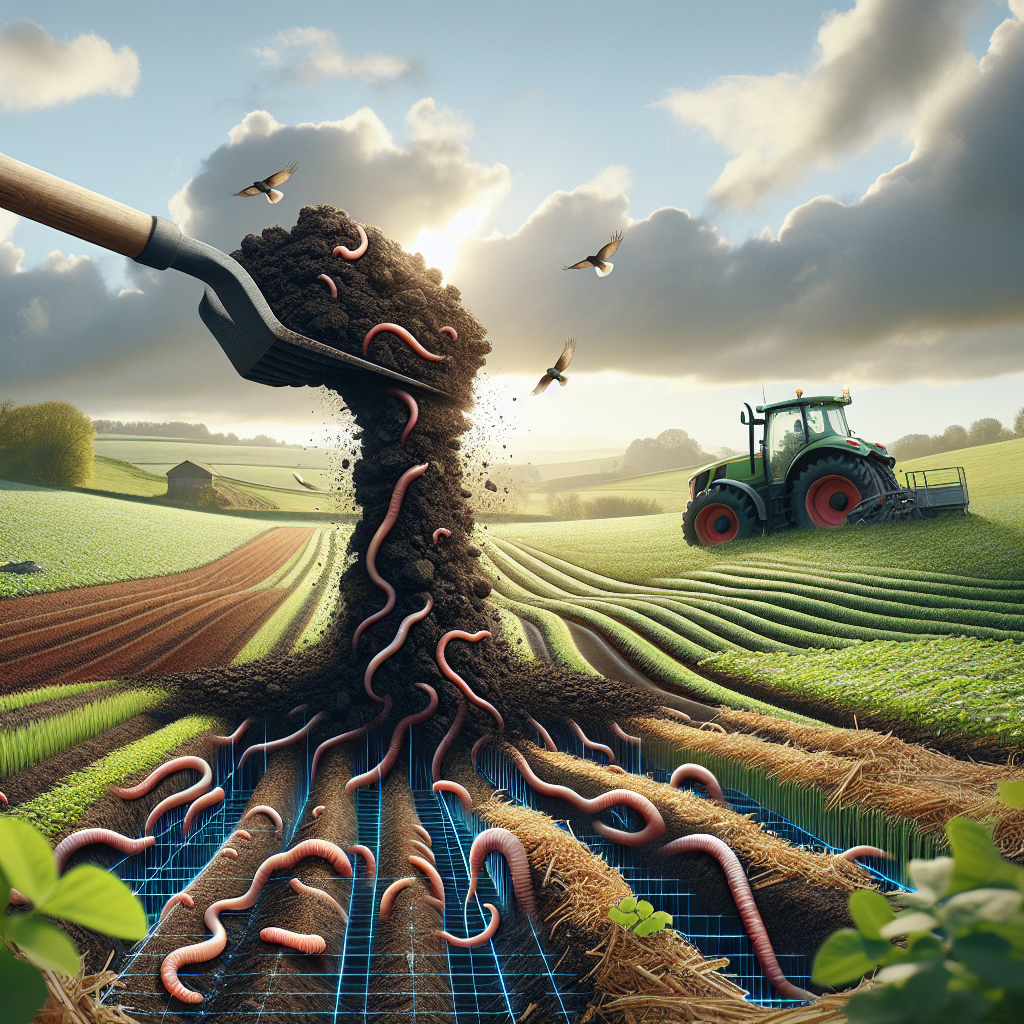
The Forgotten Art of Fall Soil Revival: 8 Organic Strategies for Small Farm Resilience
May 12, 2026
As leaves drop and temperatures cool, small farms face the silent threat of soil degradation that undermines next season's yields. This guide delivers 8 proven organic strategies to rebuild fertility, boost microbial life, and set your homestead up for explosive spring growth without synthetic inputs.
The Hidden Power of Mulching: 8 Organic Strategies to Transform Small Farm Soil
May 11, 2026
Mulching isn't just weed control--it's a game-changer for moisture retention, soil biology, and nutrient cycling on small farms. This practical guide reveals eight proven organic mulching methods tailored for homesteaders and gardeners to boost fertility without synthetic inputs.
7 Summer Pest Traps That Sabotage Small Farm Harvests
May 10, 2026
Small farms lose precious crops every summer to sneaky pests that evade common defenses. This guide reveals seven overlooked traps and organic fixes to protect your yields without chemicals.
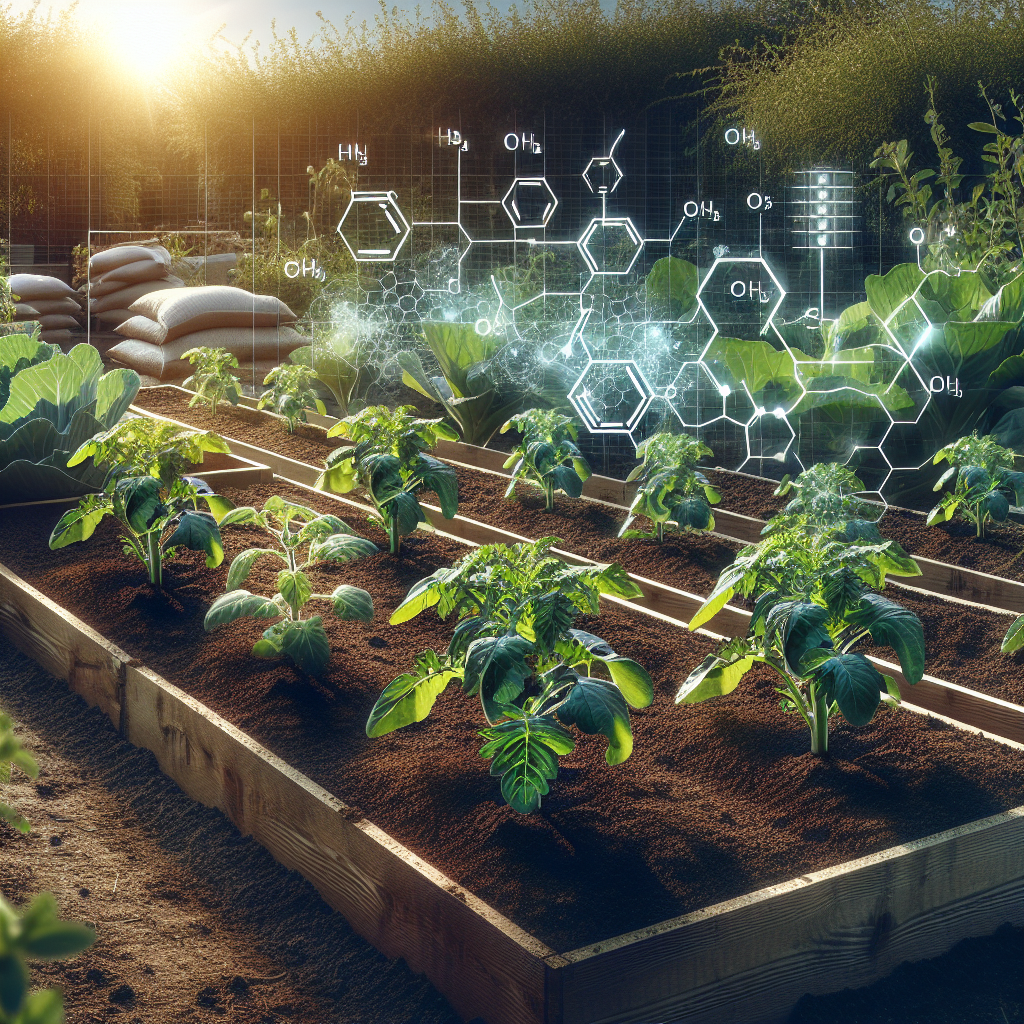
Spring Nutrient Deficiencies: 7 Organic Fixes to Supercharge Small Farm Vitality
May 9, 2026
Spring brings rapid growth but also hidden nutrient shortages that sap crop vigor on small farms. This guide delivers seven proven organic remedies to detect and correct deficiencies, ensuring thriving plants without synthetic inputs.
Crop Diseases Under the Microscope: 9 Organic Fixes for Small Farm Resilience
May 8, 2026
Uncover the most common crop diseases plaguing small farms and homesteads, with practical organic solutions to keep your yields thriving. This guide empowers home gardeners and small-scale producers with actionable steps rooted in sustainable practices.
7 Fall Soil Health Oversights That Doom Small Farm Yields
May 7, 2026
Fall's cooling temperatures expose hidden soil vulnerabilities that small farmers often overlook, leading to weakened crops come spring. This guide uncovers seven common mistakes and delivers practical, organic fixes to rebuild soil fertility without expensive inputs.
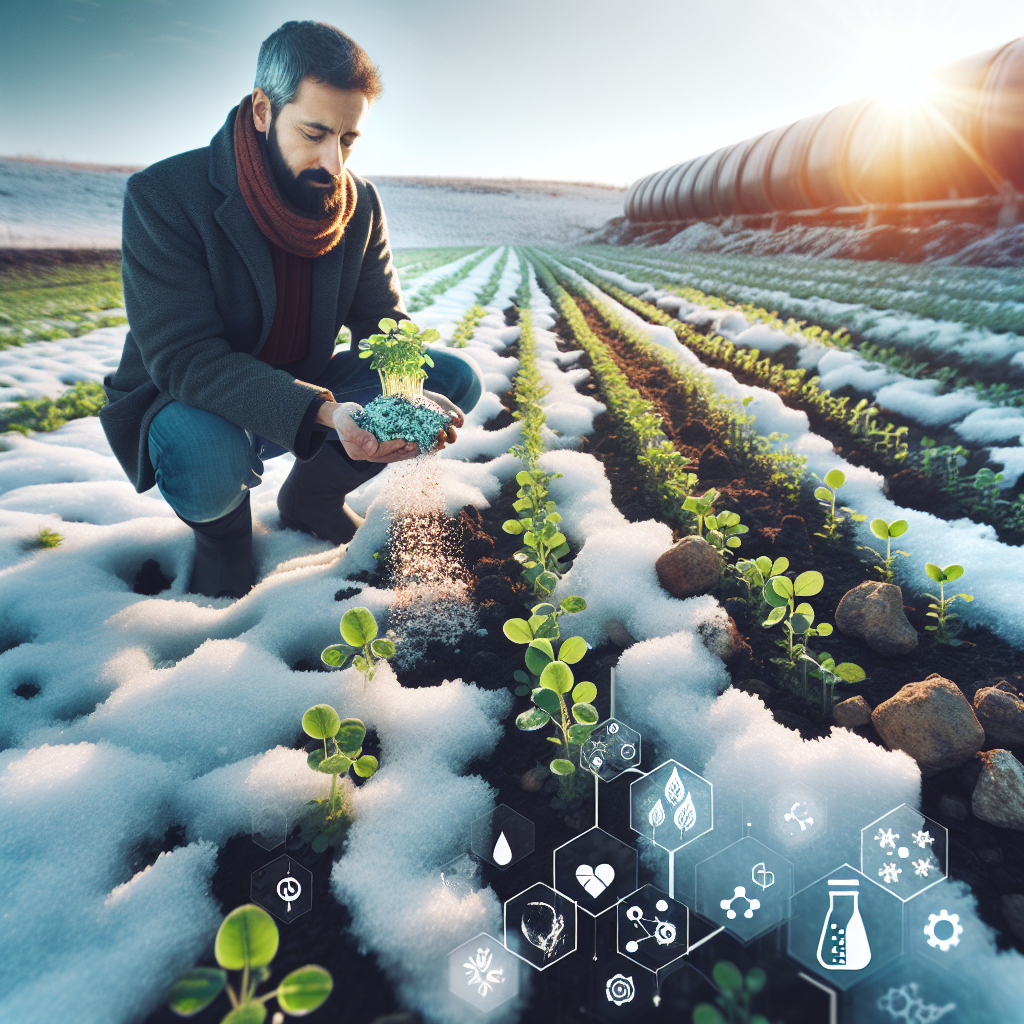
Winter Nutrient Deficiencies: 8 Organic Fixes to Revive Small Farm Crops
May 6, 2026
Winter's chill often hides nutrient shortages that weaken small farm crops, setting the stage for spring struggles. This guide reveals eight proven organic strategies to detect and correct deficiencies without synthetic inputs, keeping your homestead thriving year-round.
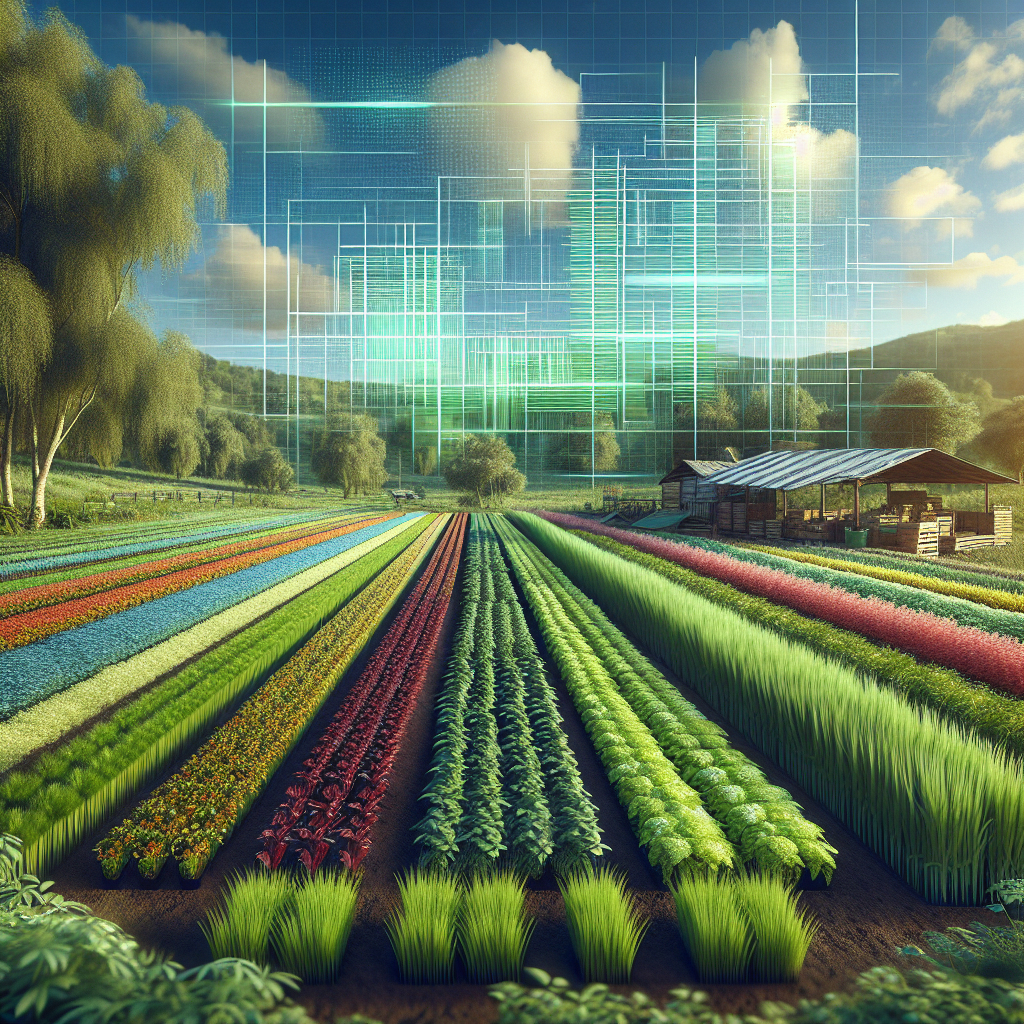
Crop Rotation Realities: 6 Organic Patterns That Deliver for Small Farms
May 5, 2026
Small farms often fail at crop rotation due to poor planning and soil misunderstandings, leading to depleted yields. This deep dive reveals six proven organic patterns tailored for homesteads and home gardens, with practical steps to implement them effectively.
Spring Soil Prep: 9 Organic Steps to Prime Small Farms for Explosive Growth
May 4, 2026
Unlock the secrets to transforming weary winter soil into a thriving foundation for your spring crops with these 9 practical organic steps. Tailored for small farmers and homesteaders, this guide delivers actionable techniques to boost fertility without synthetic inputs or heavy spending.
Summer Companion Planting: 10 Organic Pairings to Boost Small Farm Resilience
May 2, 2026
Unlock the power of summer companion planting with 10 proven organic pairings tailored for small farms, homesteads, and gardens. Learn how strategic plant alliances enhance yields, deter pests naturally, and build soil health without synthetic inputs.
Autumn Companion Planting Blunders
May 1, 2026
Fall's shorter days and cooling soil demand smart companion planting to boost yields and protect crops organically. This guide uncovers seven common mistakes small farmers make and shares practical, organic fixes to turn your autumn harvest around.
7 Companion Planting Blunders That Sabotage Small Farm Yields
April 30, 2026
Small farmers often unknowingly commit companion planting errors that reduce yields and invite pests. This guide uncovers seven common blunders with organic fixes to boost your farm's efficiency and health.
Spring Companion Planting: 8 Organic Pairings to Maximize Small Farm Yields
April 29, 2026
Unlock the power of spring companion planting with eight proven organic pairings that boost yields, deter pests, and enrich soil for small farms and gardens. This practical guide delivers actionable strategies tailored for homesteaders seeking efficiency without chemicals.
Fall Pest Siege: 9 Organic Defenses to Shield Small Farms from Invading Armies
April 28, 2026
Autumn brings a surge in crop pests that can devastate small farm yields just before harvest. This guide delivers nine proven organic strategies to fortify your fields, from natural barriers to biological allies, ensuring healthier produce without chemicals.
Spring Soil Awakening: 6 Organic Techniques to Ignite Fertility on Small Farms
April 25, 2026
Unlock the secrets to transforming weary spring soil into a thriving foundation for your crops with these six proven organic methods tailored for small-scale operations. From cover crop selection to microbial boosts, this guide equips homesteaders and gardeners with practical steps for maximum fertility without synthetic inputs.
Fall Soil Revival: 8 Organic Strategies to Rebuild Fertility for Small Farms
April 24, 2026
As autumn leaves fall, small farms face the silent threat of soil depletion that undermines next year's yields. This guide delivers 8 proven organic strategies to revive your soil naturally, boosting long-term productivity without synthetic inputs.
Why 85% of Small Farms Struggle with Nutrient Deficiencies - And 7 Organic Fixes That Restore Balance
April 23, 2026
Nutrient deficiencies silently sabotage small farm yields, mimicking pests and diseases while draining your soil's potential. This deep dive reveals 7 proven organic strategies to identify, prevent, and correct them without synthetic fixes.
Why Crop Rotation Fails 80% of Small Farms - And 6 Organic Patterns That Deliver Results
April 22, 2026
Crop rotation sounds simple, but most small farmers botch it, leading to depleted soils and poor yields. This deep dive reveals proven organic patterns tailored for homesteads and 1-acre plots, plus smart ways to track and optimize without guesswork.
Why Summer Heatwaves Are Silently Killing Small Farm Yields - And 7 Organic Strategies to Fight Back
April 21, 2026
Summer heatwaves strike small farms hardest, stressing crops and slashing productivity without warning. This guide reveals seven proven organic tactics to protect your harvest, from strategic **mulching** to heat-tolerant planting, helping homesteaders and gardeners thrive in scorching conditions.
Why 90% of Small Farms Fail at Pest Management - And 8 Organic Fixes That Actually Work
April 20, 2026
Pests wipe out crops on small farms every season, but most organic methods fall short without precise timing and identification. This deep dive reveals 8 battle-tested strategies to protect your yields naturally, from trap crops to beneficial insects.
Why Small Farms Can't Survive Without AI-Powered ROI Tracking - And How It Reveals Hidden Profits
April 19, 2026
Small farms often operate in the red without realizing where money leaks away, but AI-powered financial tracking changes that by simplifying expense logging and delivering clear ROI insights per crop. Learn how OnlyCrops AI's Financial Pulse turns raw data into actionable profitability strategies for homesteaders and market gardeners.
Why Zoning Your Small Farm Chaos into Profit Zones Feels Impossible - And How AI Changes Everything
April 18, 2026
Small farms often struggle to track performance across scattered plots like greenhouses, fields, and backyards, leading to overlooked issues and missed opportunities. OnlyCrops AI's Zone Management turns your farm into organized, data-driven zones for smarter decisions and better efficiency.
Why Companion Planting Feels Like Guesswork for Small Farms - And How AI Makes It Foolproof
April 17, 2026
Small farmers and gardeners often struggle with companion planting due to trial-and-error mismatches that waste space and invite pests. OnlyCrops AI delivers precise, data-driven recommendations tailored to your crops, location, and zones for better yields and natural pest control.
Why 70% of Small Farms Lose Money - And How AI-Powered Financial Tracking Can Turn the Tide
April 16, 2026
Small-scale farmers often struggle with hidden losses that erode profits, but OnlyCrops AI's Financial Pulse changes that with simple expense tracking and crop-specific ROI analysis. This deep dive reveals practical steps to achieve farm profitability without complex spreadsheets or guesswork.
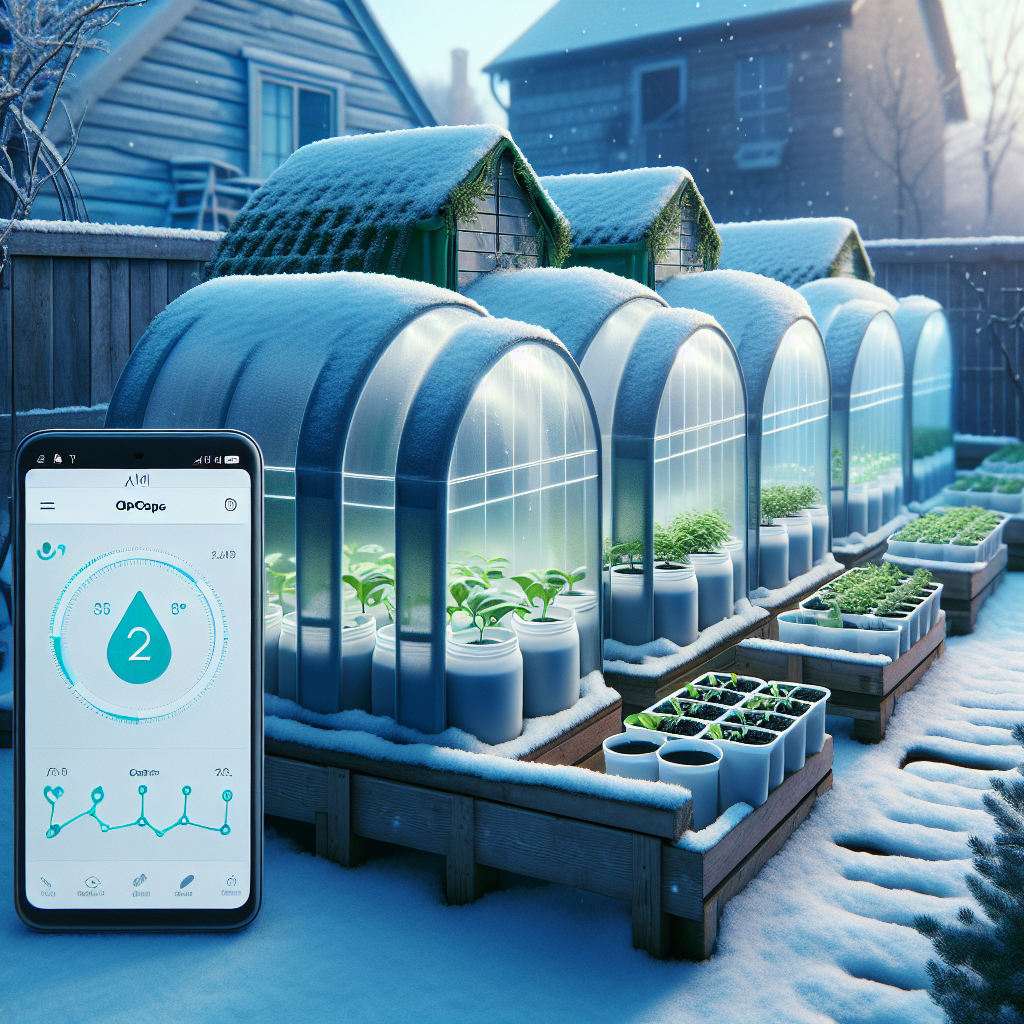
Winter Sowing Mastery: Use AI to Start Seeds Indoors and Thrive in Cold Climates Without a Greenhouse
April 16, 2026
Discover how small farmers and gardeners can beat winter blues with winter sowing techniques, supercharged by OnlyCrops AI for precise timing and health monitoring. Get organic plans, custom schedules, and hyper-local weather alerts to ensure bumper spring yields from your backyard or small plot.
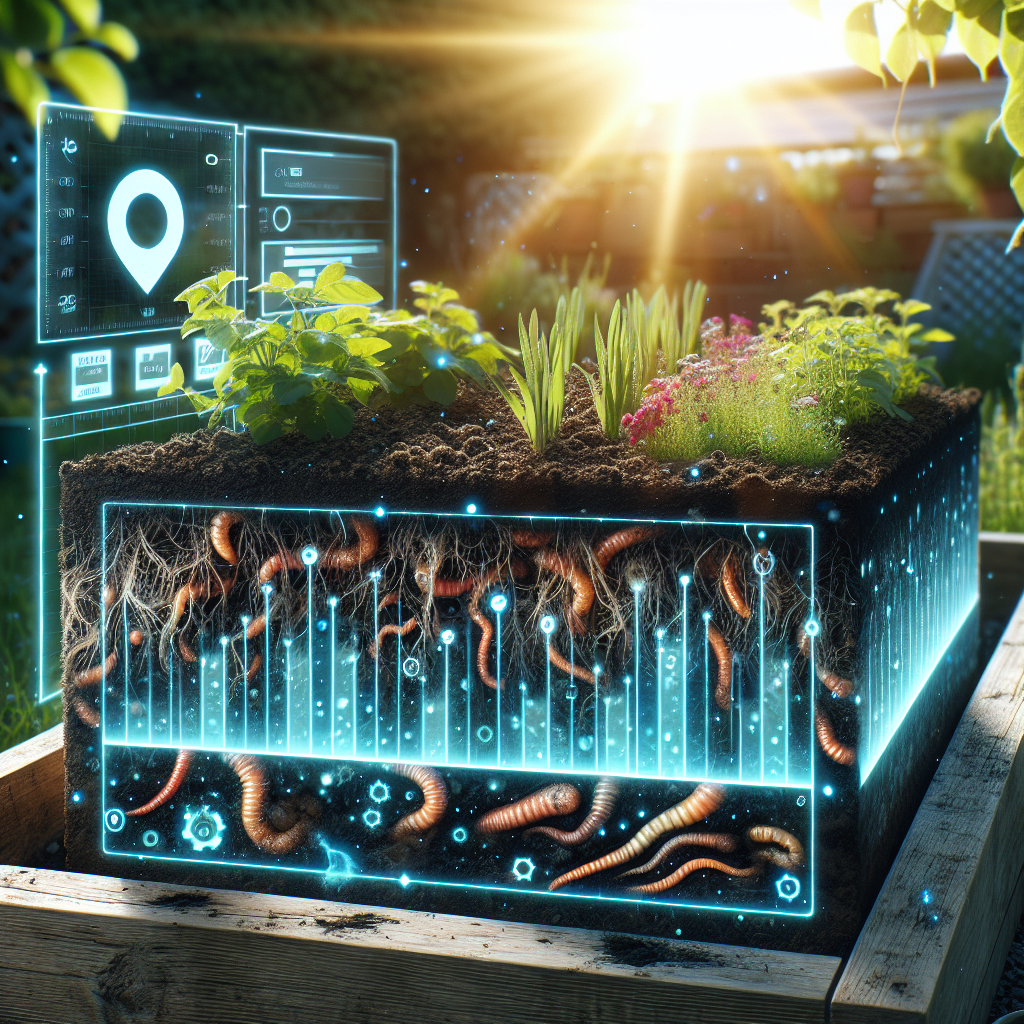
Soil Health Mastery: 5 Proven Strategies for Small Farms to Build Fertile Ground Without Breaking the Bank
April 15, 2026
Discover practical, organic methods to supercharge your soil health on a small farm or homestead, from no-till techniques to smart composting. Learn how OnlyCrops AI simplifies testing, tracking, and optimizing your soil for bumper crops year after year.
Fall Companion Planting Guide: Boost Yields and Soil Health for Small Farms and Gardens
April 14, 2026
Discover proven companion planting strategies tailored for fall planting to maximize your harvest, deter pests organically, and enrich soil naturally. Perfect for small farmers and homesteaders using OnlyCrops AI to plan efficient, high-yield gardens without the guesswork.
Why Timing Kills Small Farm Profits - And How AI Task Scheduling Saves Your Harvests
April 13, 2026
Missed watering or late harvesting can wipe out small farm yields overnight, but automated AI task scheduling changes that by creating custom crop calendars tailored to your exact conditions. Learn how OnlyCrops AI streamlines your daily operations for organic success without the guesswork.
Why 80% of Small Farms Battle Weather Disasters - And How Hyper-Local AI Forecasts Can Save Your Harvest
April 12, 2026
Unexpected weather wipes out crops on 80% of small farms each year, turning hard work into heartbreak. OnlyCrops AI's hyper-local weather tools and smart scheduling deliver precise alerts and plans to protect your yields without the guesswork.

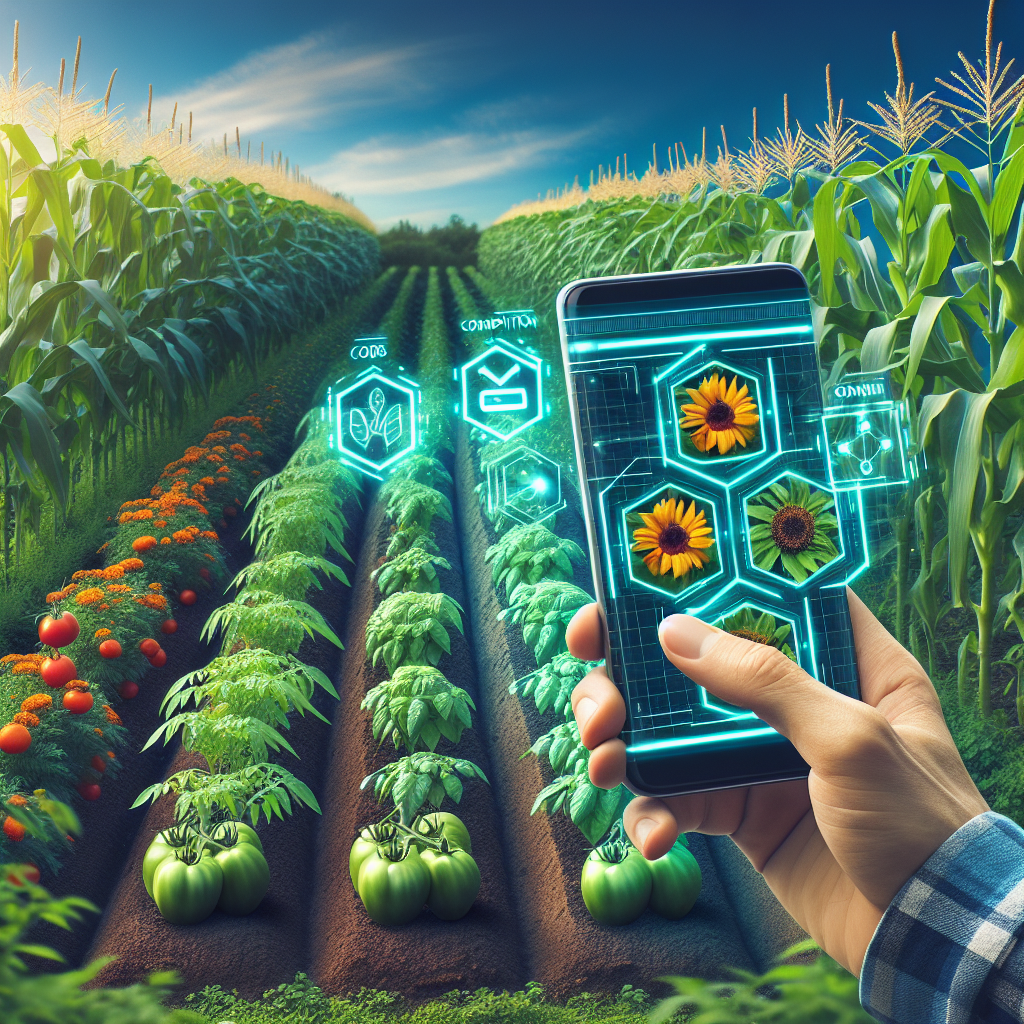
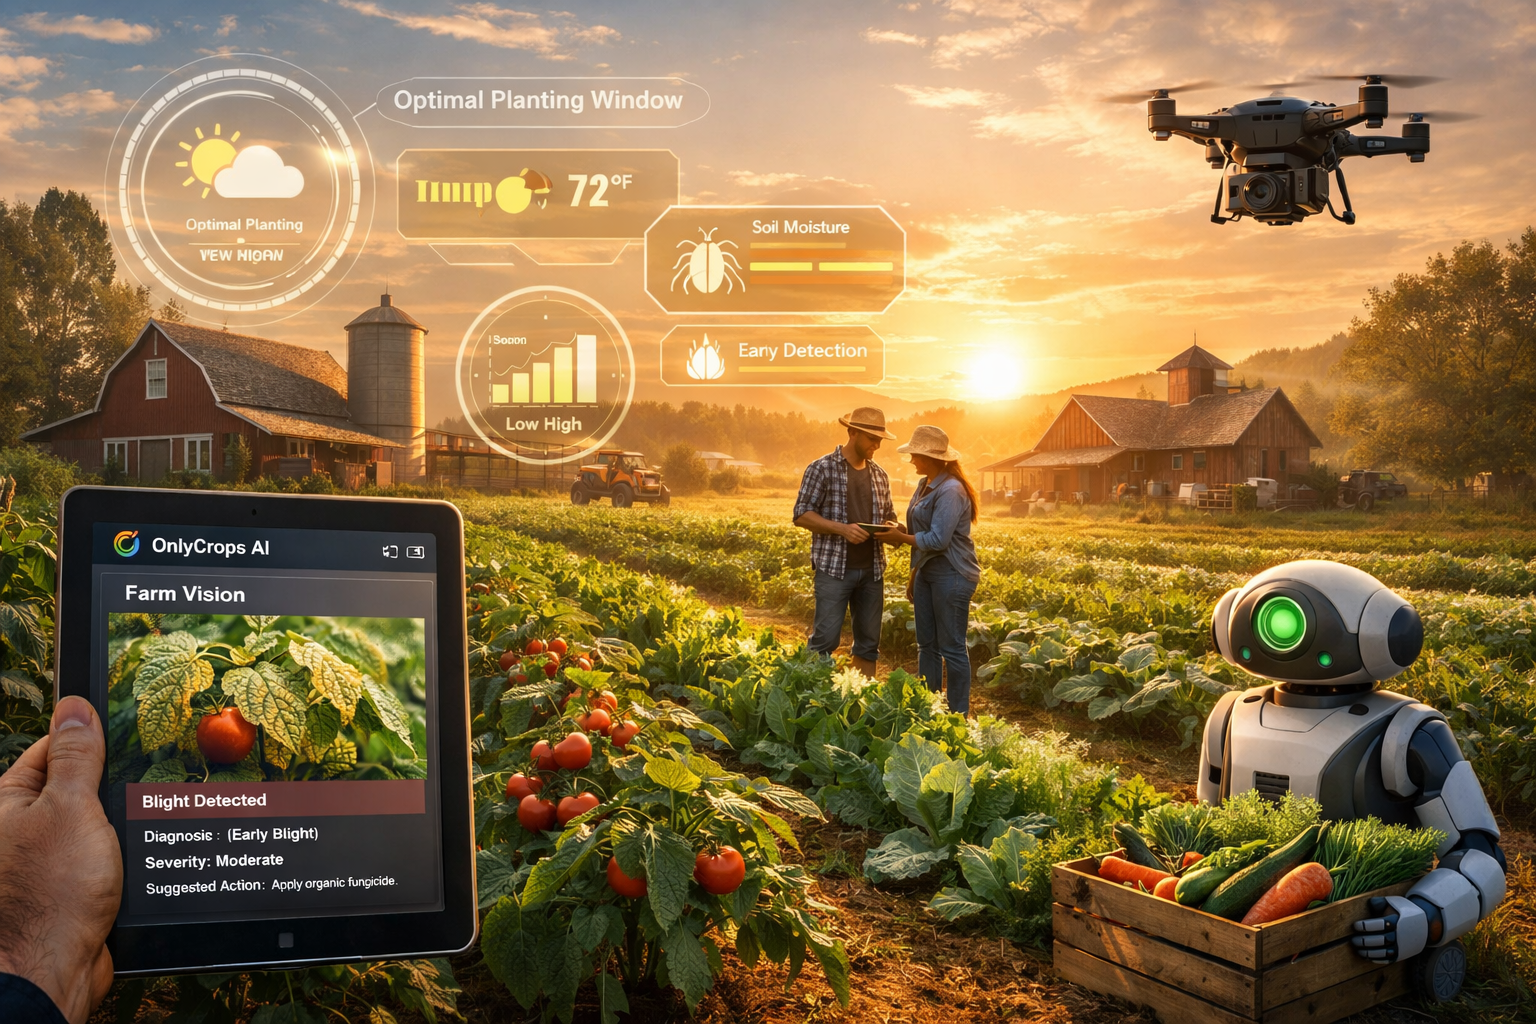
Why Misidentifying Plants Costs Small Farms Thousands - And How AI Camera Diagnosis Fixes It Fast
April 11, 2026
Small farmers lose crops and time every season guessing at plant species and health issues. OnlyCrops AI's Farm Vision turns your phone camera into an instant diagnostic tool, delivering organic fixes tailored to your farm.
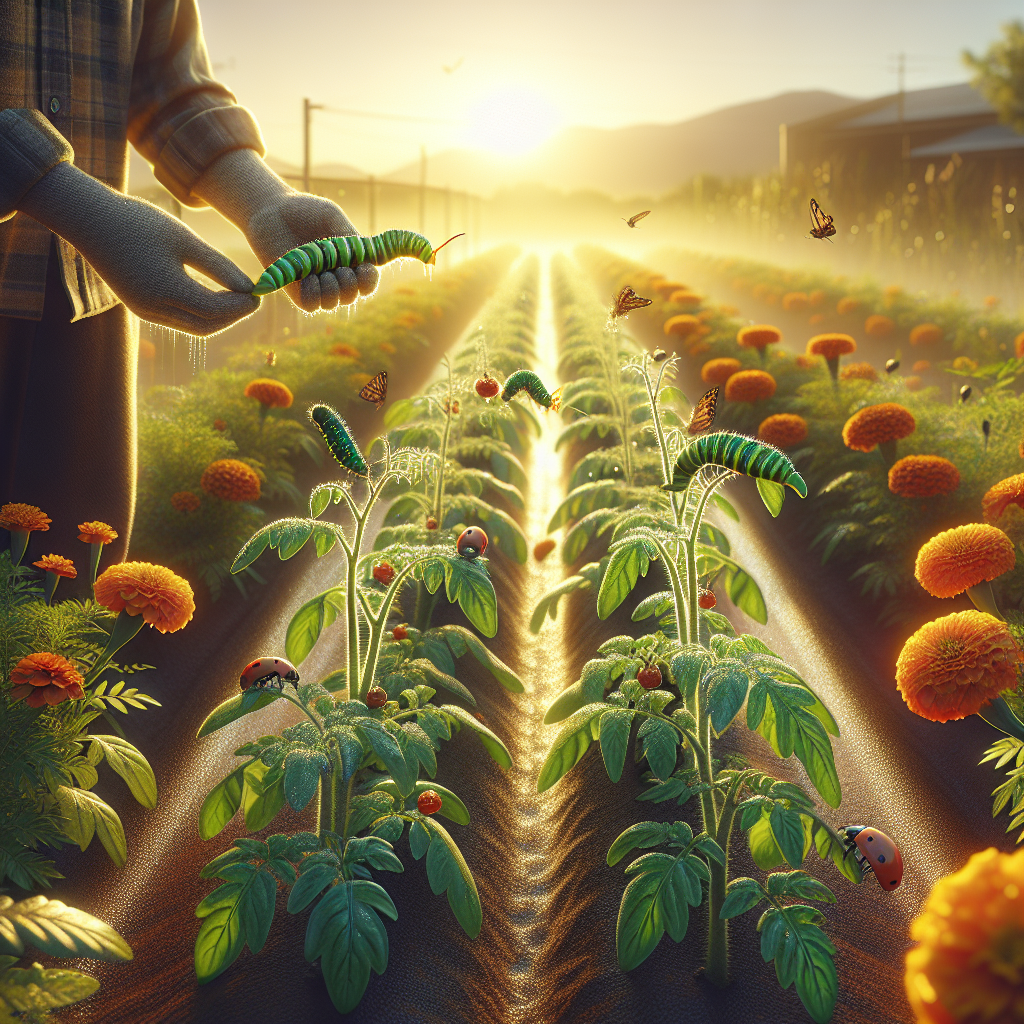
Spring Pest Patrol: Organic AI Strategies to Shield Your Crops from Common Invaders
April 10, 2026
Discover how OnlyCrops AI empowers small farmers and gardeners to spot and stop spring pests organically before they destroy your harvest. Get instant diagnoses, tailored action plans, and smart companion planting tips to keep your crops thriving without chemicals.
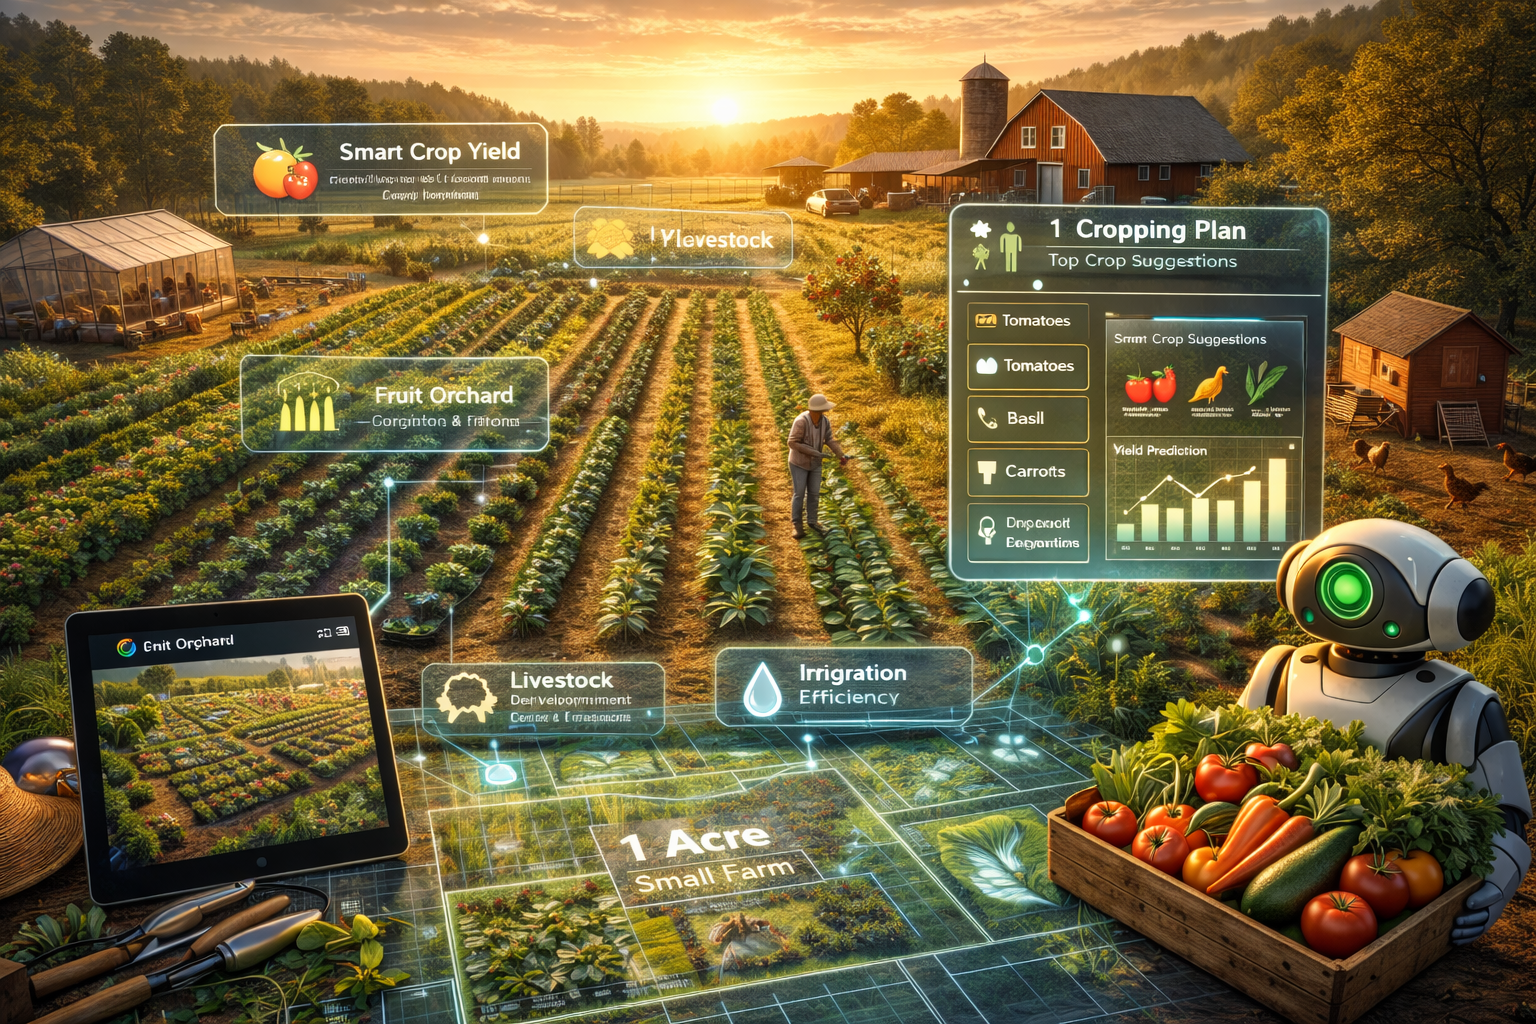
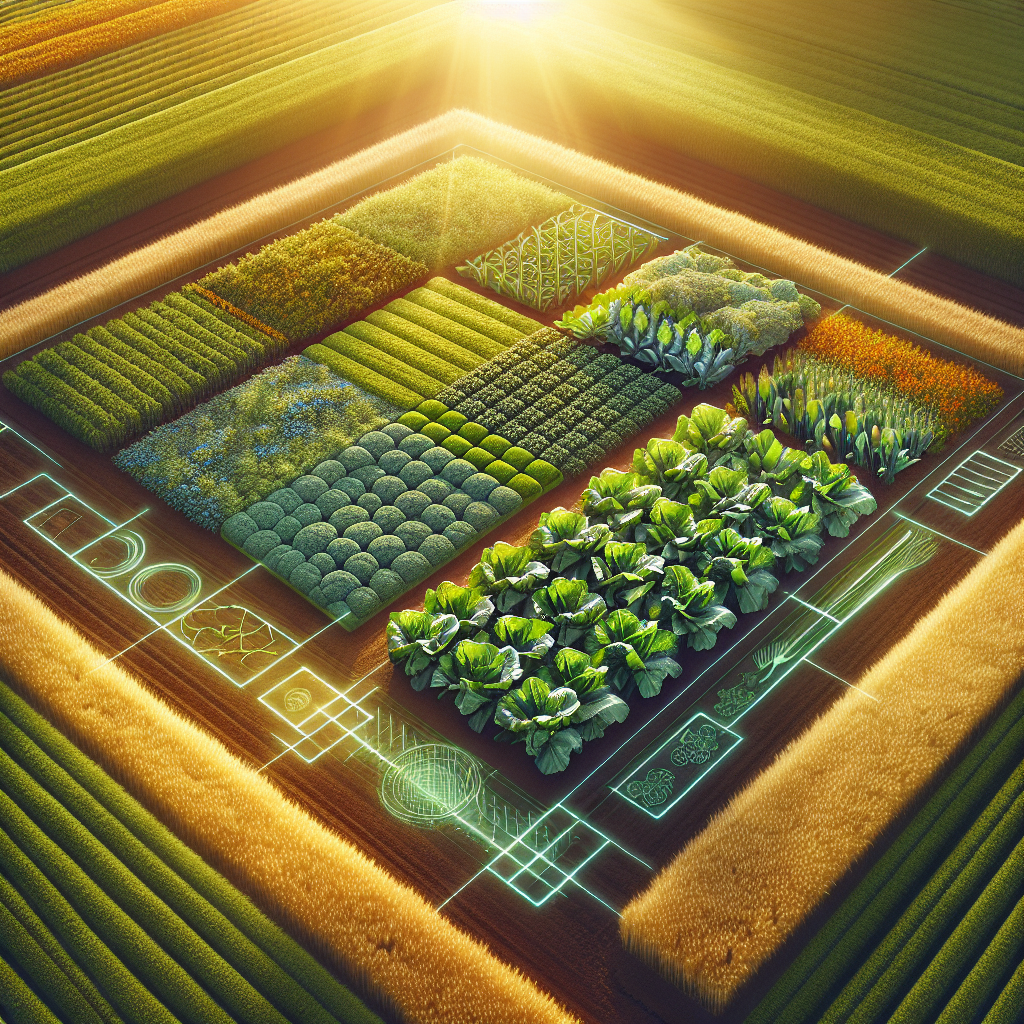
The 1-Acre Blueprint: How to Plan and Optimize a High-Yield Small Farm Using AI
March 6, 2026
A single acre can produce far more than most people expect. Learn how smart planning, efficient crop design, and AI-powered tools can transform one acre into a productive and profitable small farm.
The High-Yield Homestead: 7 Expensive Mistakes Small Farmers Make (and How AI Prevents Them)
February 13, 2026
Small mistakes on a homestead can quickly become expensive problems. Discover the seven most common errors small farmers make--and how AI tools can help prevent them before they impact your harvest.
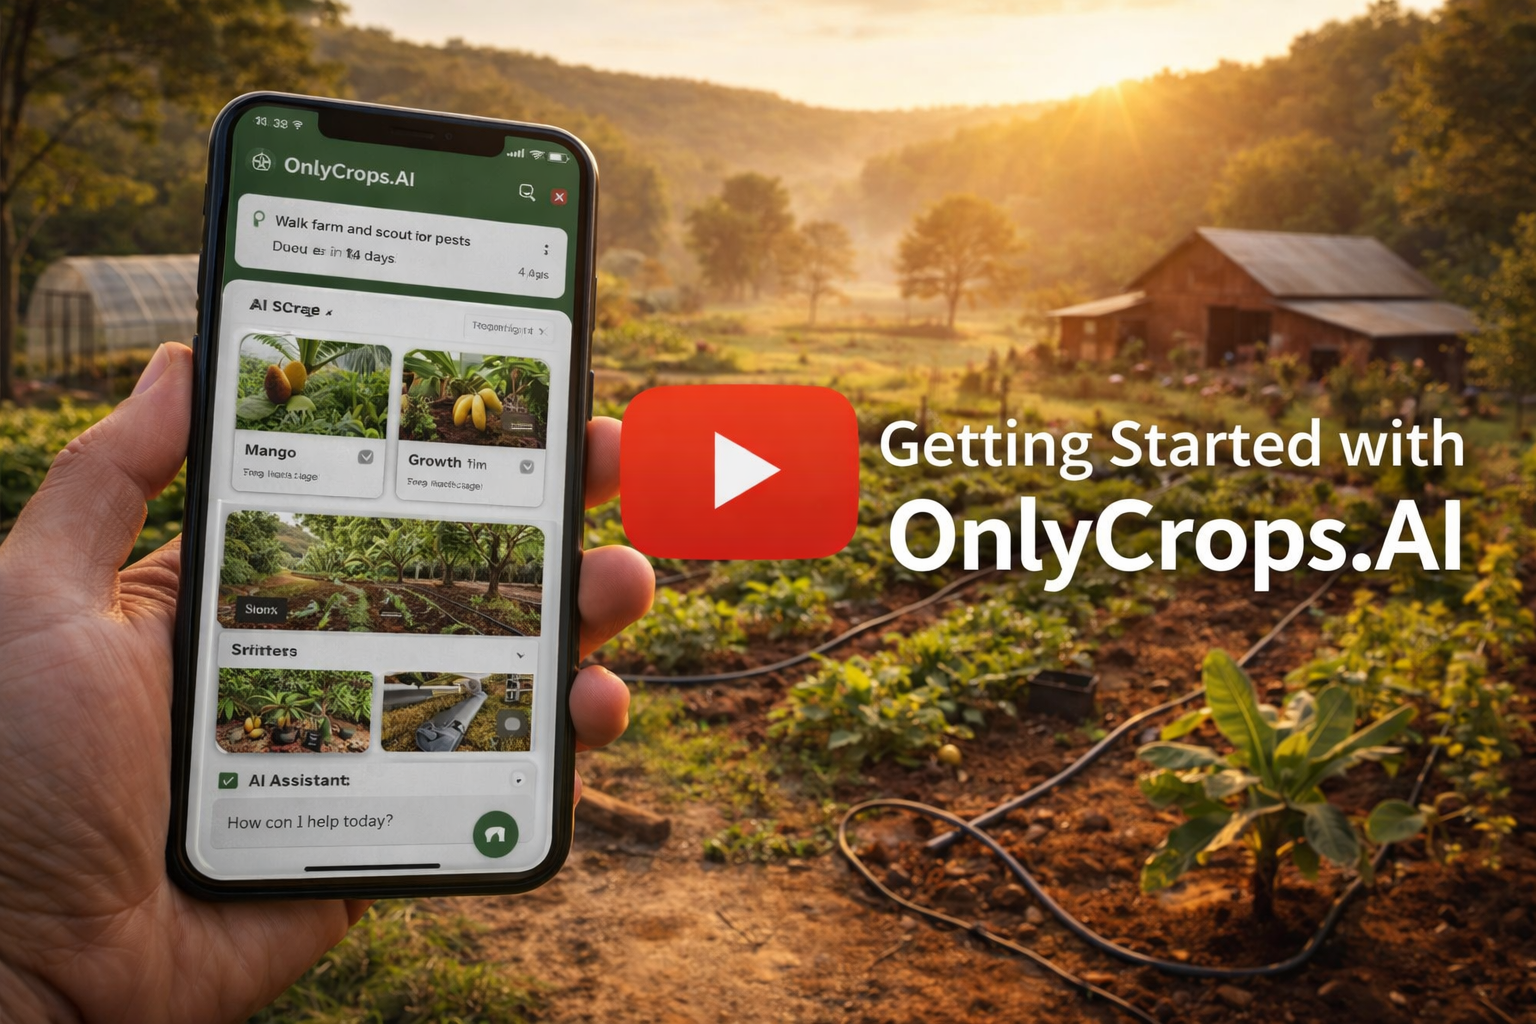
How to get started with OnlyCrops.AI (video guide)
January 29, 2026
Video guide to getting started with OnlyCrops.AI - learn how to add crops, transactions, zones and how to use the AI assistant with your own farm data!
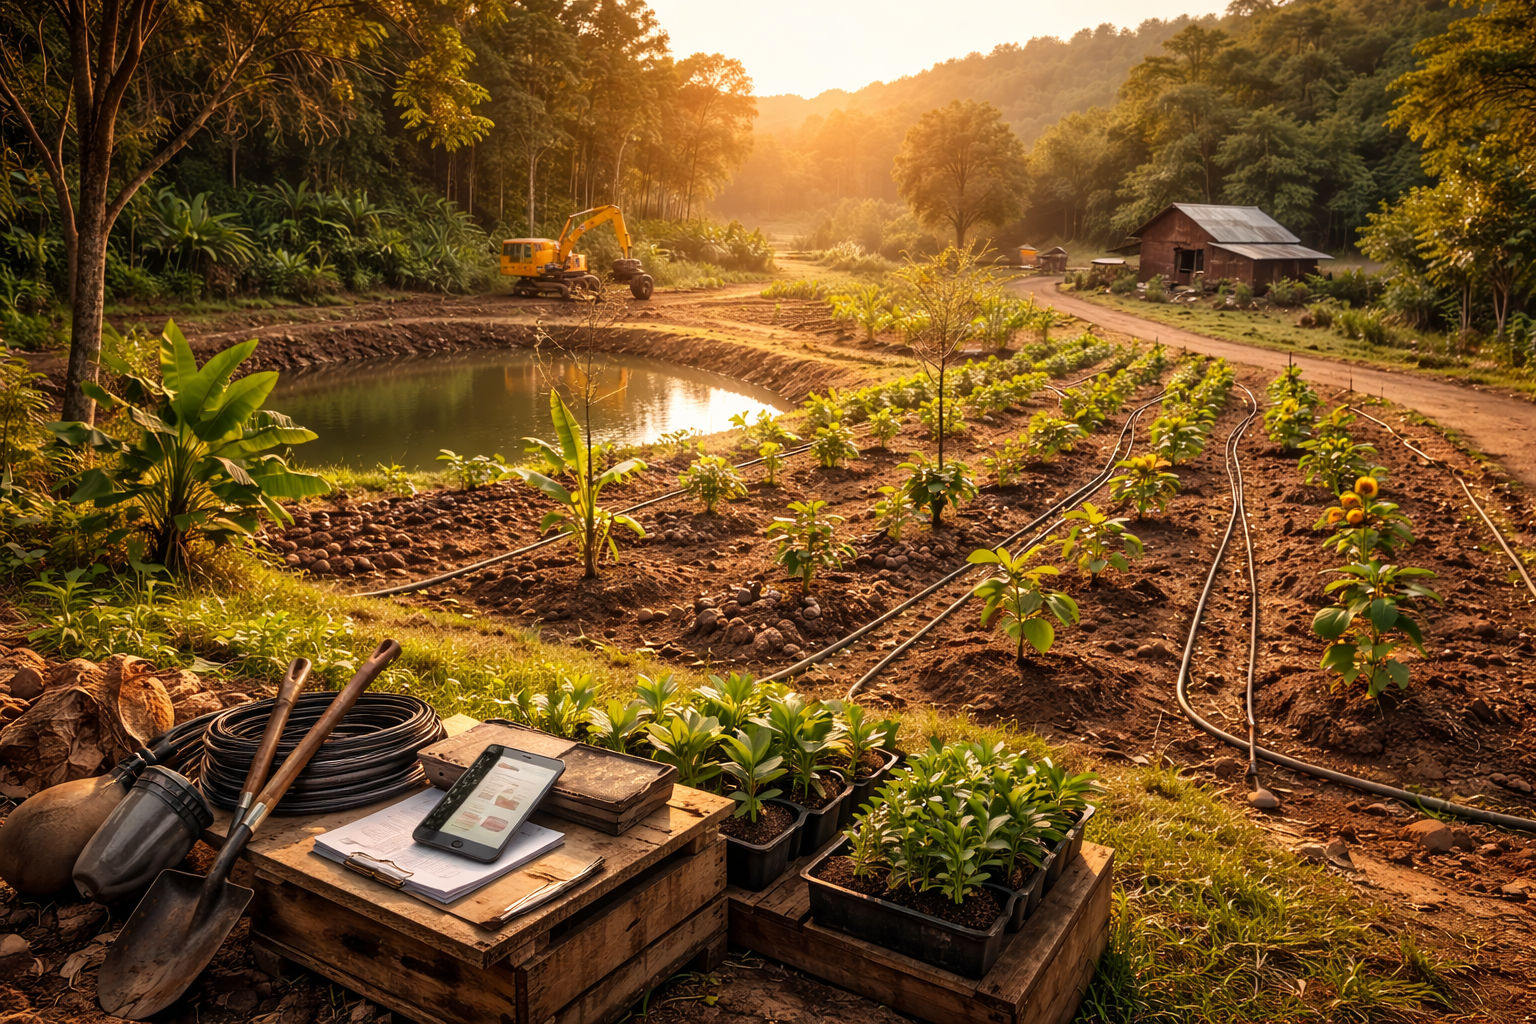
Founders Farm: Building a Farm From Scratch (and Using OnlyCrops AI to Stay Sane)
January 20, 2026
Welcome to Founders Farm--my ongoing experiment in turning raw land into a working tropical farm without drowning in chaos. This first post covers the big milestones--clearing bamboo, building tracks, digging a pond, installing irrigation, planting the first trees--and how OnlyCrops AI helped me plan, track, and remember what I'd otherwise forget.
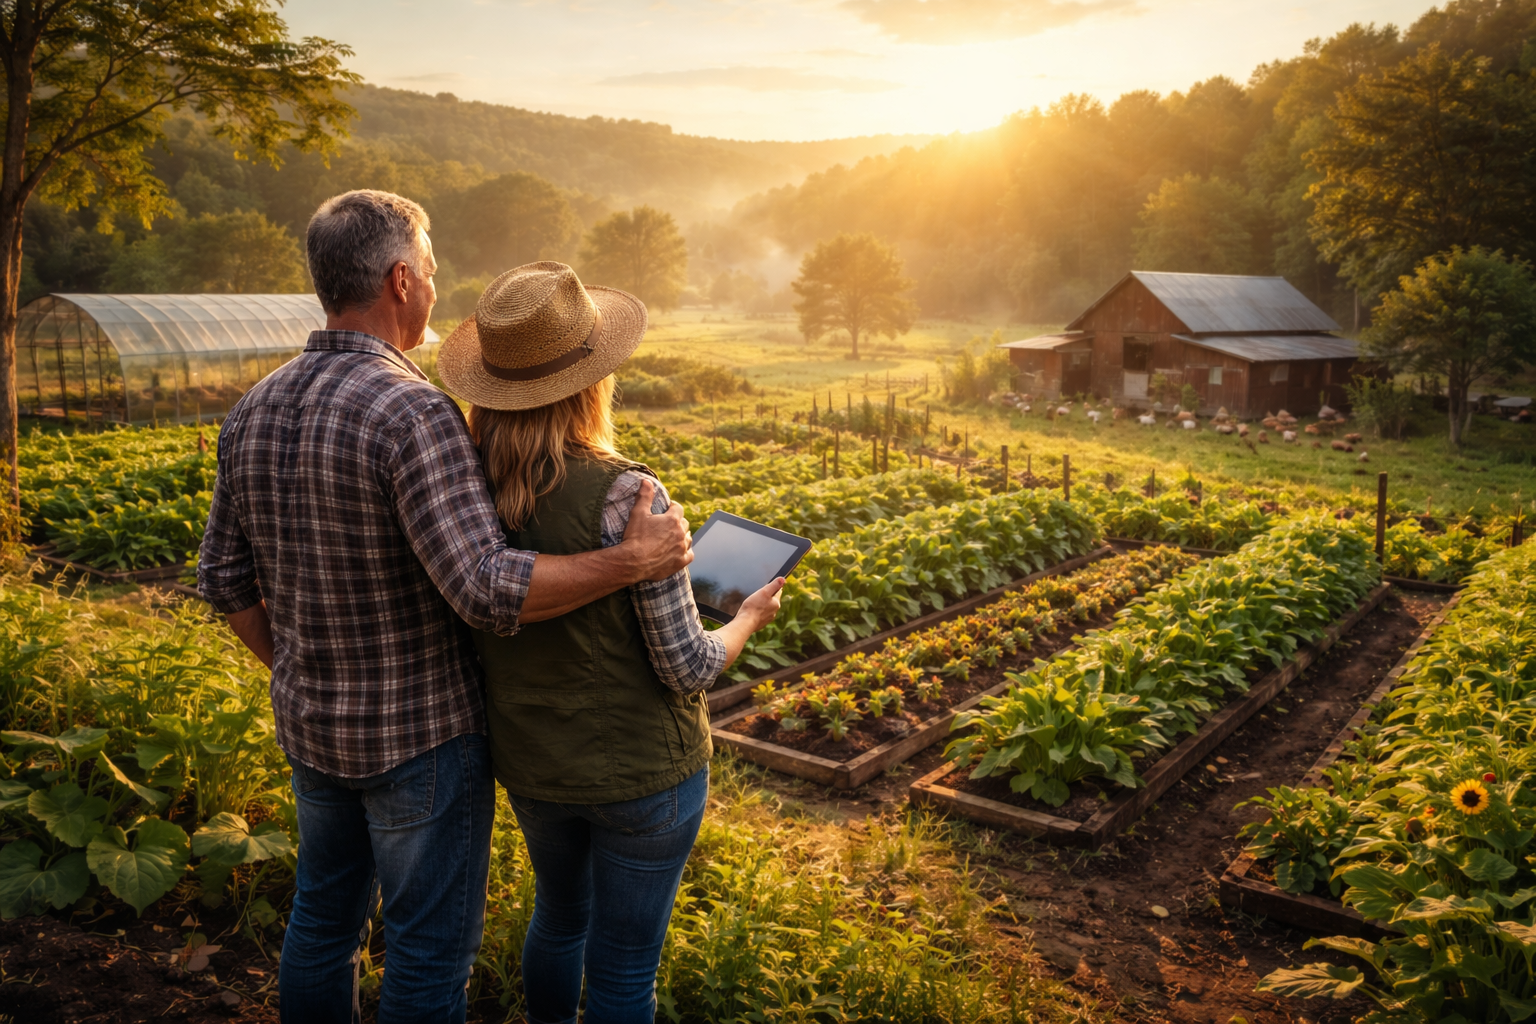
From Keyboard to Kitchen Garden: Why Tech Workers Dream of Retiring to a Farm (and How to Make It Real)
January 19, 2026
More and more tech workers are trading burnout for birdsong--and discovering that the hardest part isn't buying land, it's running the farm. Here's how to plan a smoother transition and use simple, practical tools to stay on top of what matters.
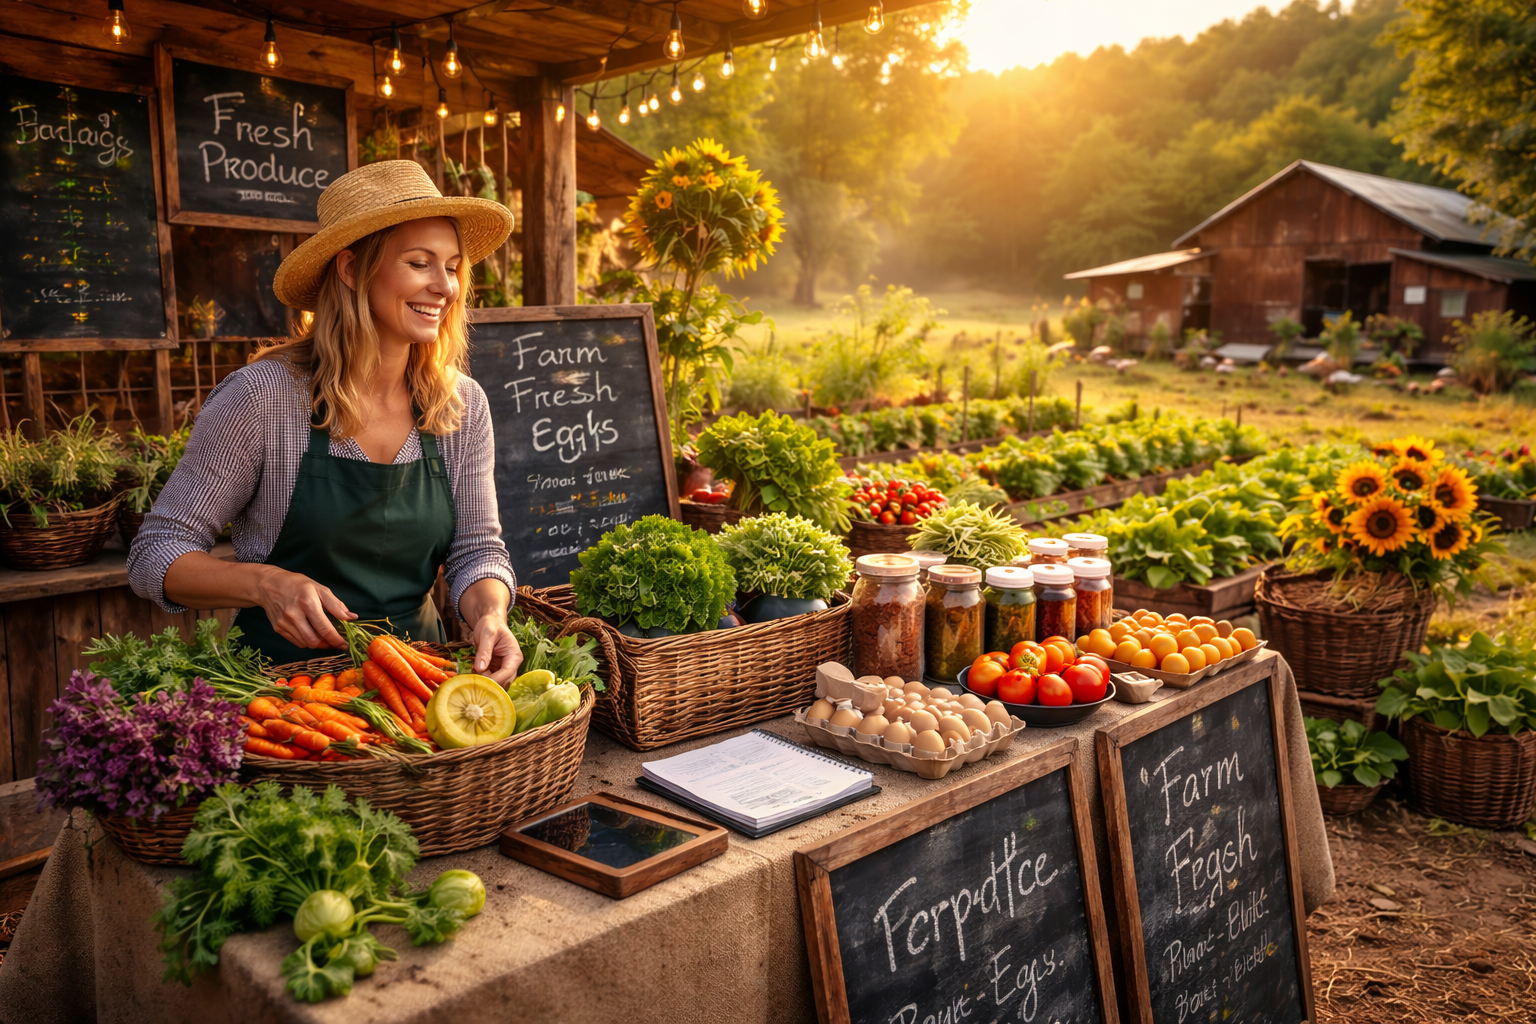
From Hobby Garden to Side-Income: Realistic Ways to Monetize a Small Farm Without Burning Out
January 14, 2026
Turning a hobby garden into meaningful income is possible--but only if you keep it simple, repeatable, and aligned with your time and energy. Here are practical monetization paths that small farms can run sustainably, plus how OnlyCrops AI helps you stay organized without burning out.
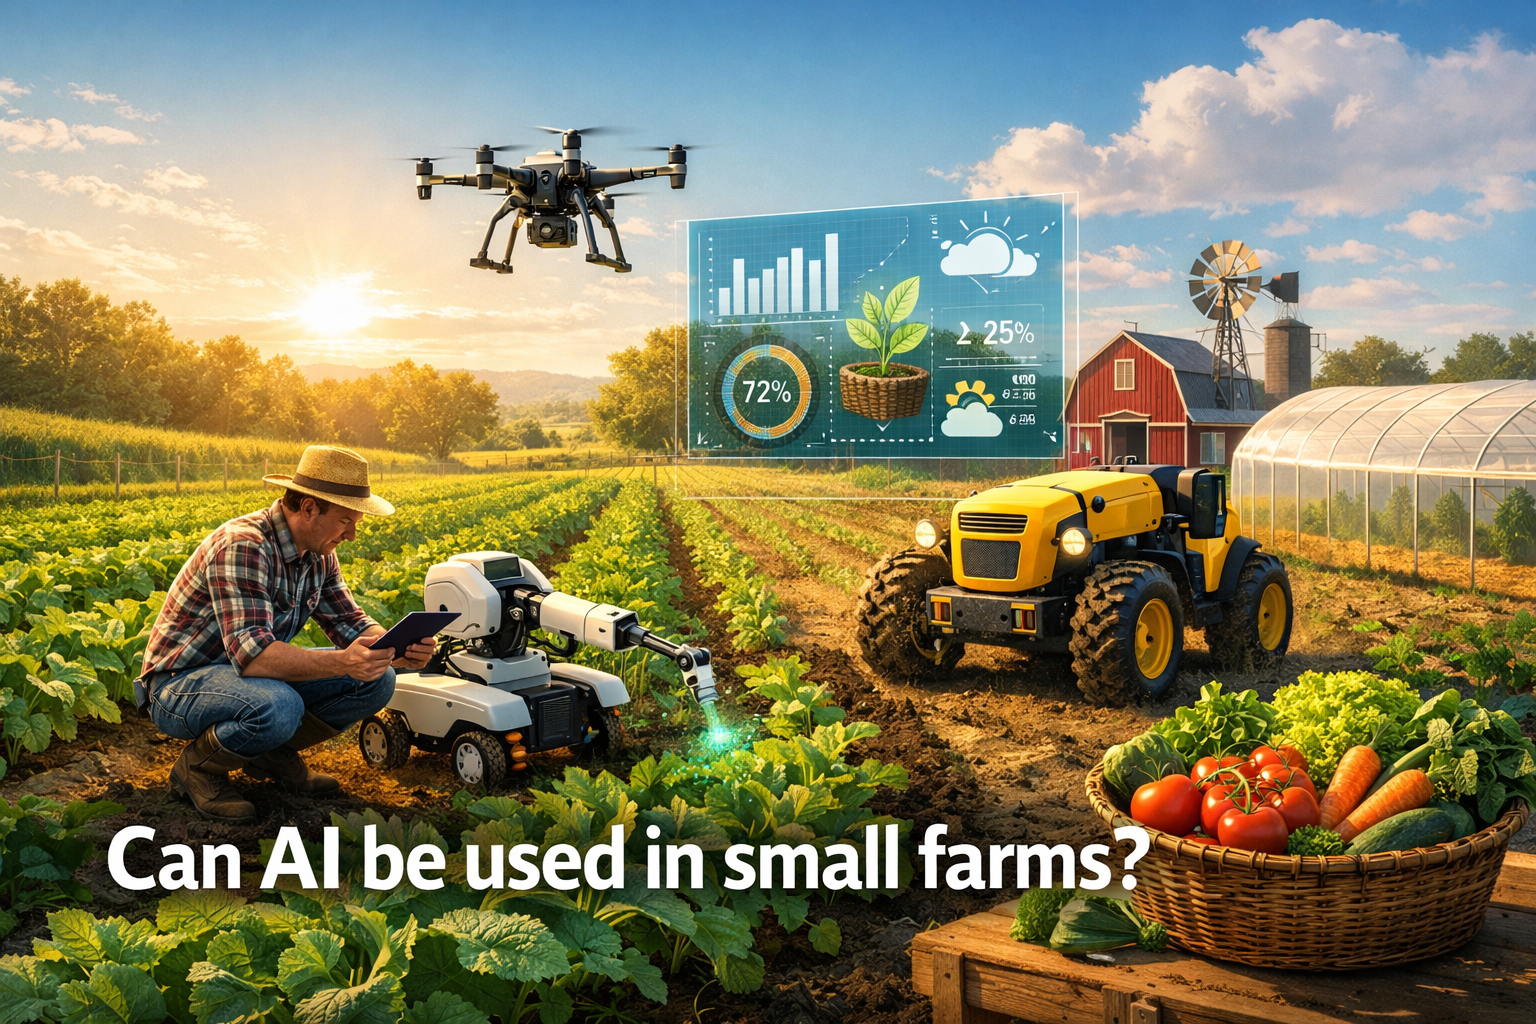
Can AI Be Used on Small Farms? Practical Ways to Get Real Results Without Big Budgets
January 12, 2026
AI isn't just for industrial agriculture. Small farms can use simple, affordable AI tools to save time, spot issues early, and make better decisions--without losing the hands-on feel that makes small-scale farming work.
Organic Farming for Hobby Farms: A Practical Guide to Growing Clean, Healthy Food on a Small Scale
January 4, 2026
Learn the essentials of organic farming for hobby farms - from building soil health and managing pests naturally to simple record keeping. See how OnlyCrops AI helps you spot issues early and stay organized so your small farm thrives.
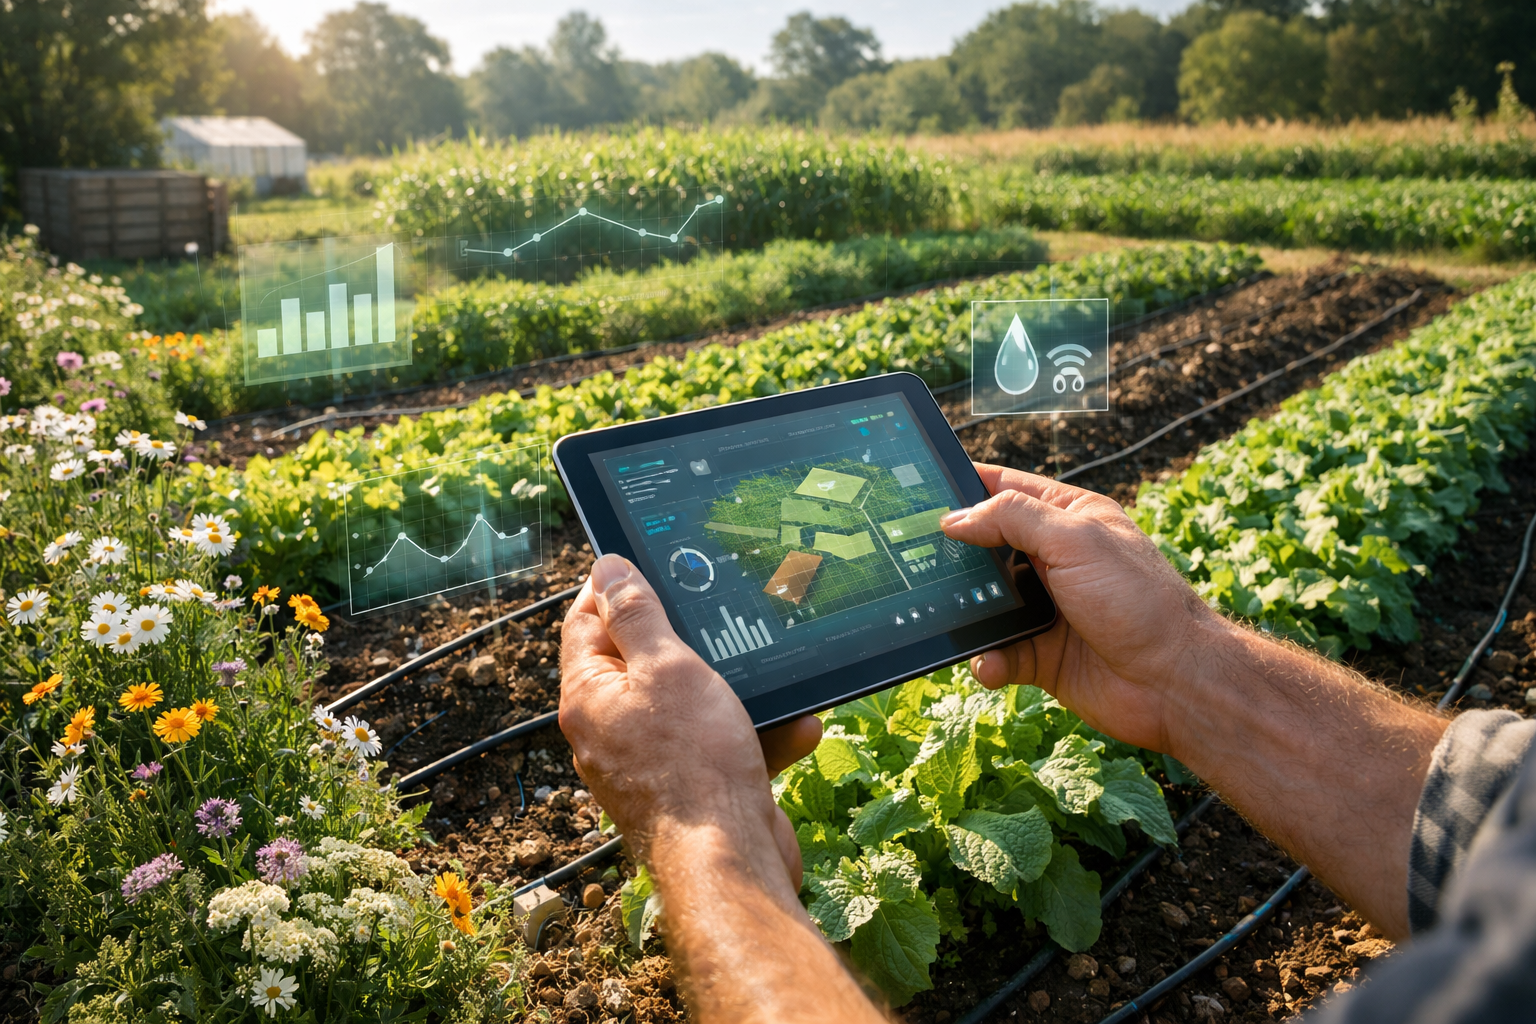
Introducing OnlyCrops AI: Your New Digital Farm Command Center
January 1, 2026
Welcome to the future of farming. Discover how OnlyCrops AI combines vision diagnosis, automated scheduling, and financial tracking into one powerful tool for growers.