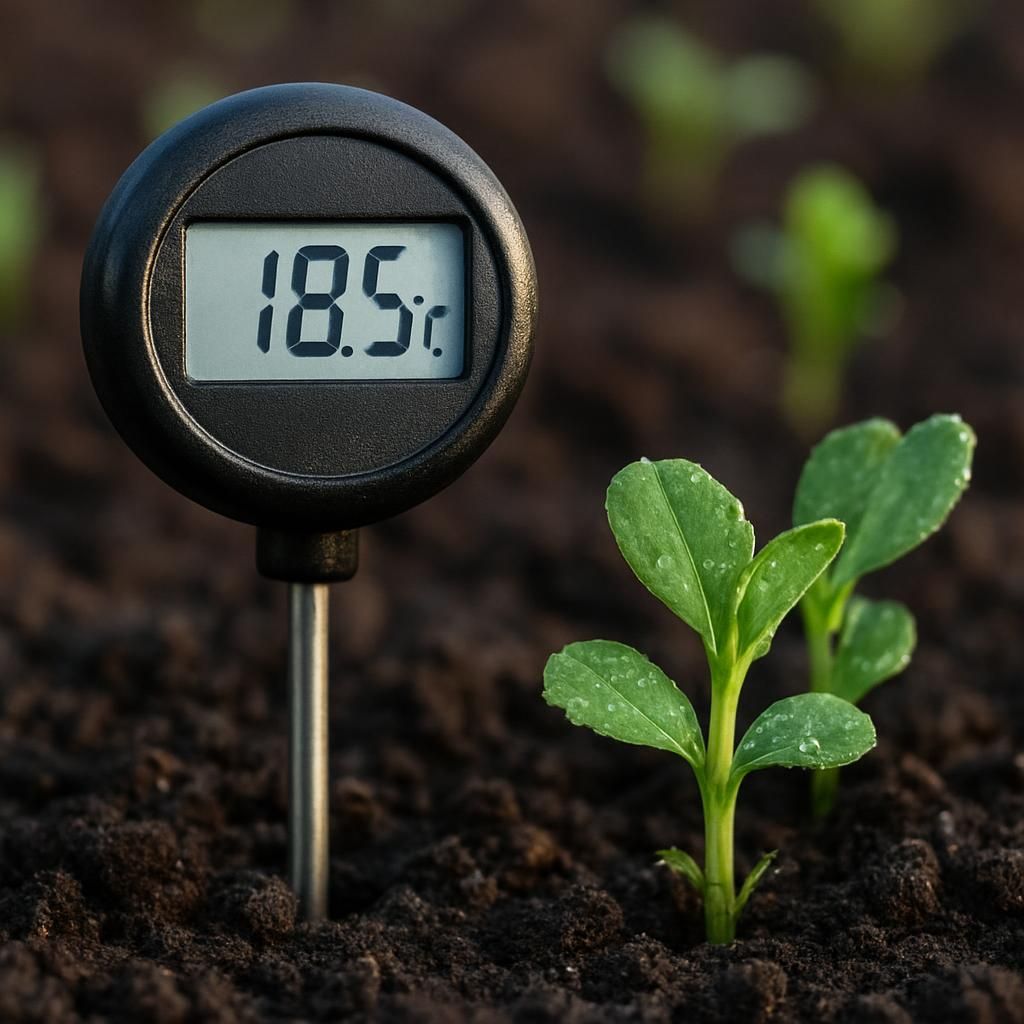
The Seed Packet Lie Most Growers Accept
Last March a neighbor planted three beds of spinach on the exact date recommended by the seed company. Two weeks later half the seedlings had rotted while the remaining plants bolted early. The packet said nothing about his south-facing slope warming faster than the surrounding valley floor.
Seed companies print average dates for broad regions. Those averages rarely match the actual conditions on a quarter-acre plot tucked behind a windbreak or next to a south wall. The difference shows up in lost weeks and wasted seed.
Why Calendar Dates Fail on Small Plots
Soil temperature at seed depth varies by as much as 8 °F between the front and back of the same garden within a single afternoon. Air movement, reflected heat from structures, and drainage patterns create distinct microclimates that no packet can capture.
When growers plant by printed dates instead of observed conditions, germination becomes a gamble. Some years seedlings emerge in five days, other years the same seed sits for twelve. Each delay shifts the entire harvest window and often collides with summer heat or early fall frost.
Building Your Own Germination Log
Start with a simple notebook or spreadsheet. Record three measurements for every new planting: soil temperature at 2-inch depth at 8 a.m., soil moisture level (squeeze test or meter), and the exact date seeds went in the ground. After each crop, note the first true leaf date and the final harvest date.
After two seasons these numbers reveal patterns that no calendar can show. A bed next to the house may reach 55 °F soil temperature ten days earlier than the open back field. That single data point changes when lettuce can be started safely.
Matching Crops to Your Measured Windows
Use the logged data to group crops by their minimum soil temperature for reliable germination. Cool-season crops such as peas and spinach can start once soil hits 45 °F at 2 inches. Warm-season crops like beans and squash wait until the same measurement reaches 60 °F.
Create a personal planting table that lists the earliest safe date for each crop based on your records, not the seed packet. Update the table each season as new observations arrive.
| Crop | Minimum Soil Temp | Your Earliest Date | Days to First Leaf | Notes |
|---|---|---|---|---|
| Spinach | 45 °F | March 12 | 6 | South bed only |
| Peas | 45 °F | March 8 | 8 | Along fence line |
| Lettuce | 50 °F | March 20 | 5 | Morning shade helps |
| Beans | 60 °F | May 5 | 7 | Wait for consistent warmth |
| Squash | 65 °F | May 18 | 5 | Avoid early cold snaps |
Adjusting for Weather Swings
Even with good records, unusual weather can shift soil temperatures. Keep a running 7-day forecast and check soil temperature again two days before planting. If a cold front is expected, delay by three to five days rather than risk poor emergence.
Track how many growing degree days accumulate between your recorded planting date and emergence. This extra column in your log helps predict future seasons more accurately.
Using the Same Data for Succession Planting
Once you know your average days to emergence, schedule follow-up plantings at intervals that match your harvest needs. If lettuce reaches full size in 38 days on average, plant a new bed every 10 days to maintain continuous supply without overlap.
The same log shows which beds warm fastest in spring and cool slowest in fall. Those beds become your first and last planting zones each season.
Linking Microclimate Records to Financial Tracking
Accurate planting dates reduce seed waste and labor spent on failed stands. When you also record input costs and sales for each bed, the connection between timing and profit becomes visible. ROI tracking shows how many dollars each extra week of production adds to the season total.
One External Reference for Temperature Data
The USDA Plant Hardiness Map provides baseline climate data, but your own soil temperature records remain the final authority for when to plant.
Putting the System Into Practice
Pick three crops you grow every year. For the next two seasons, record soil temperature, moisture, and emergence dates exactly as described. At the end of the second season you will have enough numbers to replace the seed packet calendar with a schedule built for your land.
The result is fewer blank spots in beds and more predictable income from each harvest window.