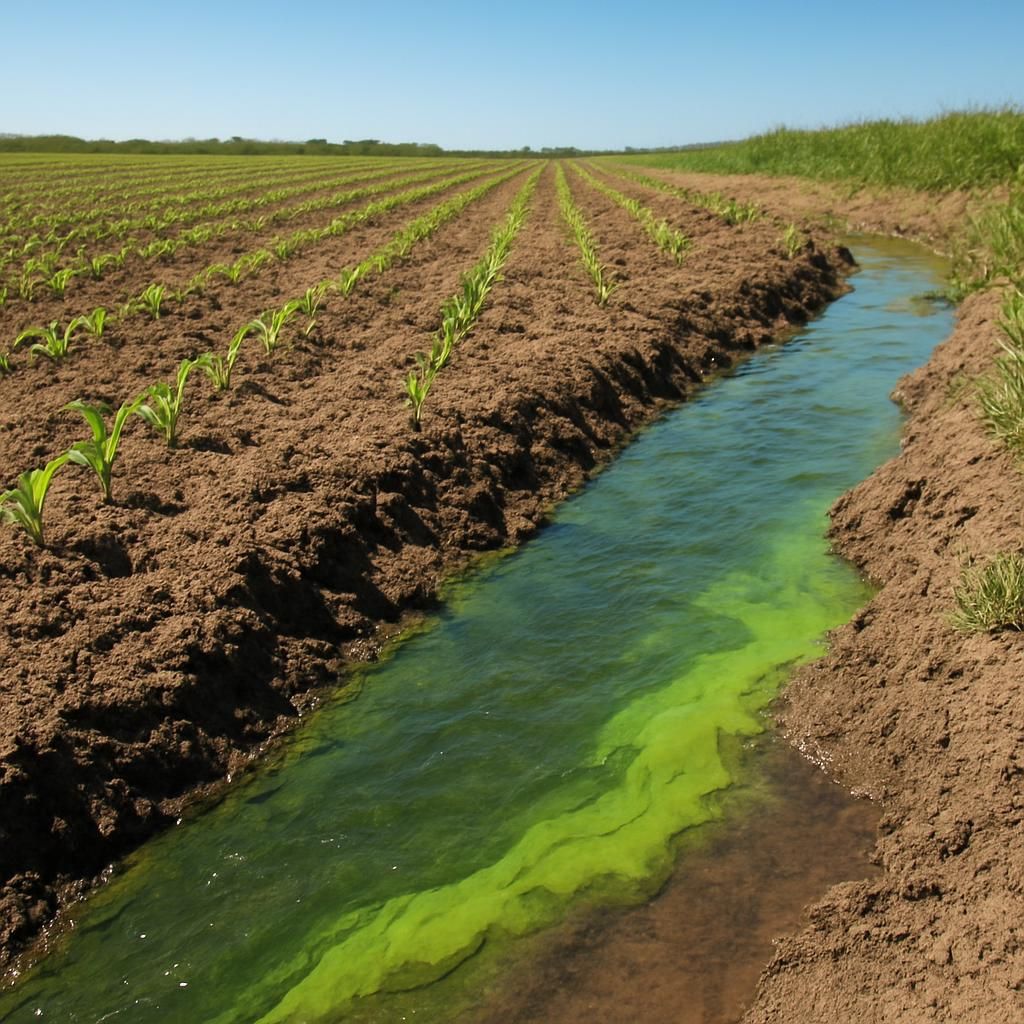
Agricultural Guide to Managing Eutrophication
Eutrophication occurs when excess nutrients, mainly nitrogen and phosphorus, enter water bodies from agricultural fields, feedlots, and irrigation return flows. The resulting algal blooms block sunlight, deplete dissolved oxygen, and create hypoxic zones that kill fish and disrupt irrigation systems used by farms downstream. Controlling eutrophication requires integrated nutrient, soil, and water management practices that keep nutrients on the land where crops can use them.
Understanding Nutrient Sources in Agriculture
Agricultural sources dominate nutrient loading in many watersheds. Synthetic fertilizers, manure applications, and legume residues contribute bioavailable nitrogen and phosphorus that move via surface runoff, tile drainage, and leaching. Soil erosion carries attached phosphorus into streams, while volatilization and denitrification release nitrogen gases that later deposit elsewhere. Farms located near rivers, lakes, or coastal zones face stricter regulatory thresholds and must adopt verifiable best management practices.
Soil Testing and Nutrient Budgeting
Accurate nutrient management begins with regular soil testing. Sample fields at 0–15 cm depth every 2–3 years and test for pH, organic matter, nitrate-N, and available phosphorus (Olsen or Bray). Use the results to calculate crop removal rates and apply only the nutrients needed. Maintain field-level nutrient budgets that track inputs (fertilizer, manure, fixation) against outputs (harvest, losses). Adjust application rates seasonally based on yield goals and previous crop credits.
Timing and Placement of Fertilizers
Apply nitrogen fertilizers close to crop uptake periods to minimize losses. Split applications of urea or ammonium nitrate into 2–4 doses timed with growth stages. Use banded or injected placement rather than broadcast spreading, especially on slopes greater than 2 %. Incorporate phosphorus fertilizers into the root zone during tillage or use subsurface banding to reduce surface runoff. Avoid fall applications of manure on frozen or snow-covered ground.
Cover Crops and Vegetative Buffers
Establish winter cover crops such as Rye or Crimson Sweet Watermelon residue mulches to capture residual nitrogen after summer crops. Maintain 6–10 m wide vegetative buffers along streams using perennial grasses or native shrubs. These buffers slow runoff velocity, trap sediment-bound phosphorus, and promote denitrification. Harvest buffer biomass periodically to export nutrients from the system.
Precision Irrigation and Drainage Management
Install soil-moisture sensors and variable-rate irrigation controllers to prevent overwatering that drives nitrate leaching. Retrofit tile drainage systems with controlled drainage structures or denitrifying bioreactors filled with wood chips. These structures promote microbial conversion of nitrate to harmless nitrogen gas before water reaches streams. Monitor drainage water quality seasonally to verify reductions.
Manure and Organic Amendment Handling
Store manure in covered, lined facilities to prevent rainfall dilution and nutrient runoff. Apply manure at agronomic rates based on nitrogen and phosphorus content, never exceeding crop needs. Incorporate manure within 24 hours of application on tilled fields. Consider composting or anaerobic digestion to stabilize nutrients and reduce pathogen loads before land application.
Conservation Tillage and Erosion Control
Adopt no-till or strip-till systems with residue cover greater than 30 % to reduce soil erosion and phosphorus transport. Use contour farming, terracing, and grassed waterways on slopes exceeding 4 %. Install sediment basins at field outlets to capture eroded particles before they reach waterways. Maintain field borders with deep-rooted perennials that stabilize banks.
Integrated Pest and Nutrient Interactions
Excess nutrients can exacerbate certain pest pressures. High nitrogen levels increase succulent growth favored by Aphids and promote fungal diseases such as Powdery mildew. Balanced fertility programs reduce plant stress and lower the need for corrective pesticide applications that may indirectly affect water quality.
Monitoring Water Quality on the Farm
Install flow-proportional samplers at tile outlets and stream crossings to measure nitrate and total phosphorus concentrations monthly. Compare results against local TMDL targets or voluntary stewardship thresholds. Share anonymized data with watershed groups to demonstrate compliance and identify hotspots requiring additional practices.
Economic and Regulatory Considerations
Many jurisdictions offer cost-share programs for nutrient management plans, cover crop seed, and bioreactor installation. Document all practices with GPS records and receipts to qualify for payments under programs such as the Environmental Quality Incentives Program. Farms that reduce nutrient losses also lower input costs and protect long-term soil productivity.
Summary of Key Practices
| Practice | Primary Nutrient Targeted | Typical Reduction Potential | Implementation Timeline |
|---|---|---|---|
| Soil testing & budgeting | N & P | 10–25 % | Annual |
| Split & banded fertilizer | N | 15–30 % | Each growing season |
| Cover crops | N | 20–50 % | Fall planting, spring termination |
| Vegetative buffers | P | 30–60 % | 1–3 years to establish |
| Controlled tile drainage | N | 30–50 % | Installation during off-season |
| Manure incorporation | N & P | 20–40 % | Within 24 h of application |
| Conservation tillage | P | 40–70 % | Continuous |
Implementing these practices systematically reduces eutrophication risk while sustaining or increasing crop yields. Continuous adaptation based on monitoring data ensures long-term water quality protection and farm resilience.
For further reading on watershed-scale nutrient dynamics, consult the Wikipedia page on Eutrophication. Additional practical insights on seasonal soil strategies are available in the blog post The Forgotten Art of Fall Soil Revival: 8 Organic Strategies for Small Farm Resilience.